

350
V. Barale and M. Gade
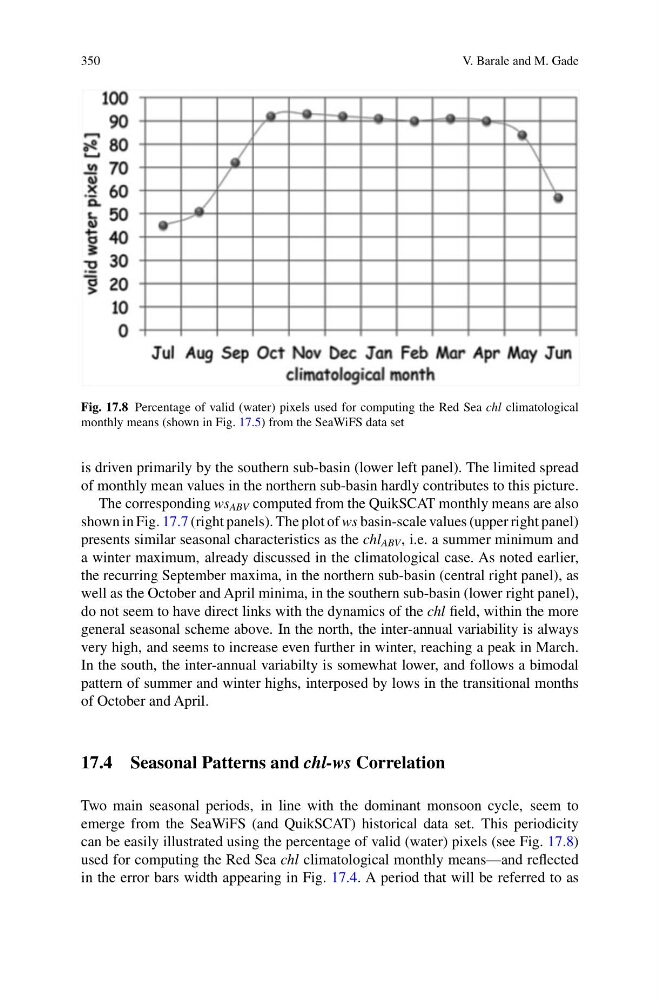
Fig. 17.8 Percentage of valid (water) pixels used for computing the Red Sea chl climatological
monthly means (shown in Fig. 17.5) from the SeaWiFS data set
is driven primarily by the southern sub-basin (lower left panel). The limited spread
of monthly mean values in the northern sub-basin hardly contributes to this picture.
The corresponding ws ABV computed from the QuikSCAT monthly means are also
shown in Fig. 17.7 (right panels). The plot of ws basin-scale values (upper right panel)
presents similar seasonal characteristics as the chl ABV , i.e. a summer minimum and
a winter maximum, already discussed in the climatological case. As noted earlier,
the recurring September maxima, in the northern sub-basin (central right panel), as
well as the October and April minima, in the southern sub-basin (lower right panel),
do not seem to have direct links with the dynamics of the chl field, within the more
general seasonal scheme above. In the north, the inter-annual variability is always
very high, and seems to increase even further in winter, reaching a peak in March.
In the south, the inter-annual variabilty is somewhat lower, and follows a bimodal
pattern of summer and winter highs, interposed by lows in the transitional months
of October and April.
17.4 Seasonal Patterns and chl-ws Correlation
Two main seasonal periods, in line with the dominant monsoon cycle, seem to
emerge from the SeaWiFS (and QuikSCAT) historical data set. This periodicity
can be easily illustrated using the percentage of valid (water) pixels (see Fig. 17.8)
used for computing the Red Sea chl climatological monthly means—and reflected
in the error bars width appearing in Fig. 17.4. A period that will be referred to as
V. Barale and M. Gade
Fig. 17.8 Percentage of valid (water) pixels used for computing the Red Sea chl climatological
monthly means (shown in Fig. 17.5) from the SeaWiFS data set
is driven primarily by the southern sub-basin (lower left panel). The limited spread
of monthly mean values in the northern sub-basin hardly contributes to this picture.
The corresponding ws ABV computed from the QuikSCAT monthly means are also
shown in Fig. 17.7 (right panels). The plot of ws basin-scale values (upper right panel)
presents similar seasonal characteristics as the chl ABV , i.e. a summer minimum and
a winter maximum, already discussed in the climatological case. As noted earlier,
the recurring September maxima, in the northern sub-basin (central right panel), as
well as the October and April minima, in the southern sub-basin (lower right panel),
do not seem to have direct links with the dynamics of the chl field, within the more
general seasonal scheme above. In the north, the inter-annual variability is always
very high, and seems to increase even further in winter, reaching a peak in March.
In the south, the inter-annual variabilty is somewhat lower, and follows a bimodal
pattern of summer and winter highs, interposed by lows in the transitional months
of October and April.
17.4 Seasonal Patterns and chl-ws Correlation
Two main seasonal periods, in line with the dominant monsoon cycle, seem to
emerge from the SeaWiFS (and QuikSCAT) historical data set. This periodicity
can be easily illustrated using the percentage of valid (water) pixels (see Fig. 17.8)
used for computing the Red Sea chl climatological monthly means—and reflected
in the error bars width appearing in Fig. 17.4. A period that will be referred to as