

17 Basic Ecosystem Dynamics in the Red Sea as Seen by Sundry . . .
349
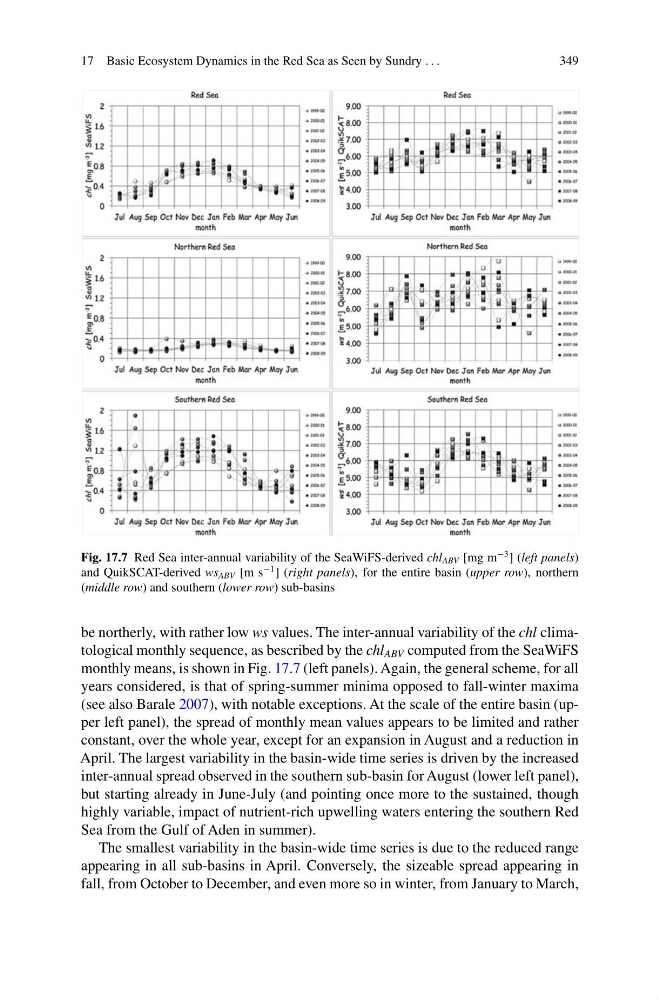
Fig. 17.7 Red Sea inter-annual variability of the SeaWiFS-derived chl ABV [mg m
−3 ] (left panels)
and QuikSCAT-derived ws ABV [m s
−1 ] (right panels), for the entire basin (upper row), northern
(middle row) and southern (lower row) sub-basins
be northerly, with rather low ws values. The inter-annual variability of the chl climatological monthly sequence, as bescribed by the chl ABV computed from the SeaWiFS
monthly means, is shown in Fig. 17.7 (left panels). Again, the general scheme, for all
years considered, is that of spring-summer minima opposed to fall-winter maxima
(see also Barale 2007), with notable exceptions. At the scale of the entire basin (upper left panel), the spread of monthly mean values appears to be limited and rather
constant, over the whole year, except for an expansion in August and a reduction in
April. The largest variability in the basin-wide time series is driven by the increased
inter-annual spread observed in the southern sub-basin for August (lower left panel),
but starting already in June-July (and pointing once more to the sustained, though
highly variable, impact of nutrient-rich upwelling waters entering the southern Red
Sea from the Gulf of Aden in summer).
The smallest variability in the basin-wide time series is due to the reduced range
appearing in all sub-basins in April. Conversely, the sizeable spread appearing in
fall, from October to December, and even more so in winter, from January to March,
349
Fig. 17.7 Red Sea inter-annual variability of the SeaWiFS-derived chl ABV [mg m
−3 ] (left panels)
and QuikSCAT-derived ws ABV [m s
−1 ] (right panels), for the entire basin (upper row), northern
(middle row) and southern (lower row) sub-basins
be northerly, with rather low ws values. The inter-annual variability of the chl climatological monthly sequence, as bescribed by the chl ABV computed from the SeaWiFS
monthly means, is shown in Fig. 17.7 (left panels). Again, the general scheme, for all
years considered, is that of spring-summer minima opposed to fall-winter maxima
(see also Barale 2007), with notable exceptions. At the scale of the entire basin (upper left panel), the spread of monthly mean values appears to be limited and rather
constant, over the whole year, except for an expansion in August and a reduction in
April. The largest variability in the basin-wide time series is driven by the increased
inter-annual spread observed in the southern sub-basin for August (lower left panel),
but starting already in June-July (and pointing once more to the sustained, though
highly variable, impact of nutrient-rich upwelling waters entering the southern Red
Sea from the Gulf of Aden in summer).
The smallest variability in the basin-wide time series is due to the reduced range
appearing in all sub-basins in April. Conversely, the sizeable spread appearing in
fall, from October to December, and even more so in winter, from January to March,