

328
S. Andréfouët
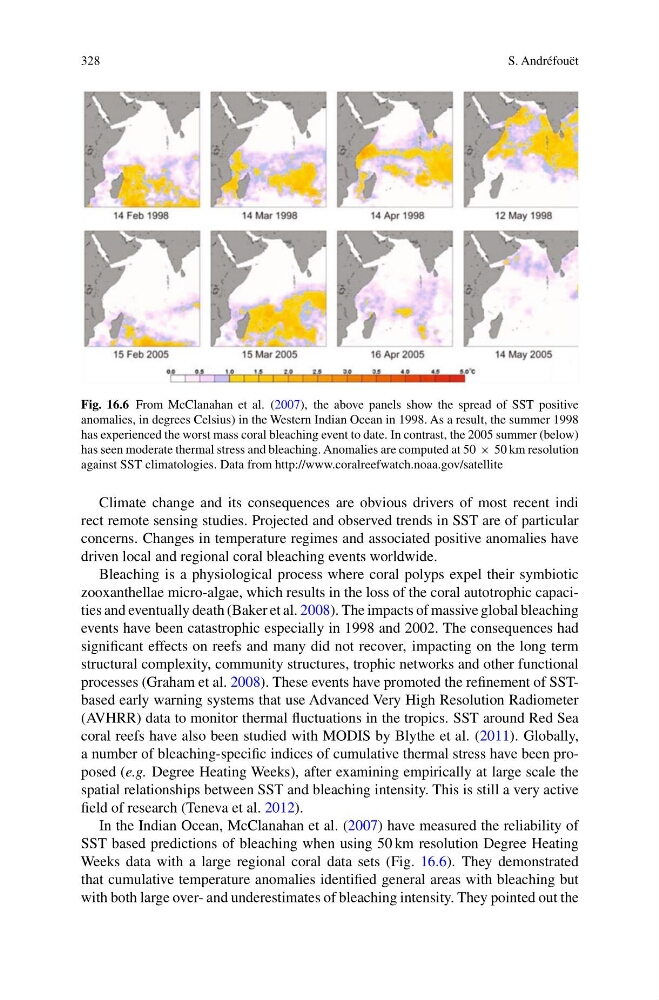
Fig. 16.6 From McClanahan et al. (2007), the above panels show the spread of SST positive
anomalies, in degrees Celsius) in the Western Indian Ocean in 1998. As a result, the summer 1998
has experienced the worst mass coral bleaching event to date. In contrast, the 2005 summer (below)
has seen moderate thermal stress and bleaching. Anomalies are computed at 50 × 50 km resolution
against SST climatologies. Data from http://www.coralreefwatch.noaa.gov/satellite
Climate change and its consequences are obvious drivers of most recent indi
rect remote sensing studies. Projected and observed trends in SST are of particular
concerns. Changes in temperature regimes and associated positive anomalies have
driven local and regional coral bleaching events worldwide.
Bleaching is a physiological process where coral polyps expel their symbiotic
zooxanthellae micro-algae, which results in the loss of the coral autotrophic capacities and eventually death (Baker et al. 2008). The impacts of massive global bleaching
events have been catastrophic especially in 1998 and 2002. The consequences had
significant effects on reefs and many did not recover, impacting on the long term
structural complexity, community structures, trophic networks and other functional
processes (Graham et al. 2008). These events have promoted the refinement of SSTbased early warning systems that use Advanced Very High Resolution Radiometer
(AVHRR) data to monitor thermal fluctuations in the tropics. SST around Red Sea
coral reefs have also been studied with MODIS by Blythe et al. (2011). Globally,
a number of bleaching-specific indices of cumulative thermal stress have been proposed (e.g. Degree Heating Weeks), after examining empirically at large scale the
spatial relationships between SST and bleaching intensity. This is still a very active
field of research (Teneva et al. 2012).
In the Indian Ocean, McClanahan et al. (2007) have measured the reliability of
SST based predictions of bleaching when using 50 km resolution Degree Heating
Weeks data with a large regional coral data sets (Fig. 16.6). They demonstrated
that cumulative temperature anomalies identified general areas with bleaching but
with both large over- and underestimates of bleaching intensity. They pointed out the
S. Andréfouët
Fig. 16.6 From McClanahan et al. (2007), the above panels show the spread of SST positive
anomalies, in degrees Celsius) in the Western Indian Ocean in 1998. As a result, the summer 1998
has experienced the worst mass coral bleaching event to date. In contrast, the 2005 summer (below)
has seen moderate thermal stress and bleaching. Anomalies are computed at 50 × 50 km resolution
against SST climatologies. Data from http://www.coralreefwatch.noaa.gov/satellite
Climate change and its consequences are obvious drivers of most recent indi
rect remote sensing studies. Projected and observed trends in SST are of particular
concerns. Changes in temperature regimes and associated positive anomalies have
driven local and regional coral bleaching events worldwide.
Bleaching is a physiological process where coral polyps expel their symbiotic
zooxanthellae micro-algae, which results in the loss of the coral autotrophic capacities and eventually death (Baker et al. 2008). The impacts of massive global bleaching
events have been catastrophic especially in 1998 and 2002. The consequences had
significant effects on reefs and many did not recover, impacting on the long term
structural complexity, community structures, trophic networks and other functional
processes (Graham et al. 2008). These events have promoted the refinement of SSTbased early warning systems that use Advanced Very High Resolution Radiometer
(AVHRR) data to monitor thermal fluctuations in the tropics. SST around Red Sea
coral reefs have also been studied with MODIS by Blythe et al. (2011). Globally,
a number of bleaching-specific indices of cumulative thermal stress have been proposed (e.g. Degree Heating Weeks), after examining empirically at large scale the
spatial relationships between SST and bleaching intensity. This is still a very active
field of research (Teneva et al. 2012).
In the Indian Ocean, McClanahan et al. (2007) have measured the reliability of
SST based predictions of bleaching when using 50 km resolution Degree Heating
Weeks data with a large regional coral data sets (Fig. 16.6). They demonstrated
that cumulative temperature anomalies identified general areas with bleaching but
with both large over- and underestimates of bleaching intensity. They pointed out the