

322
S. Andréfouët
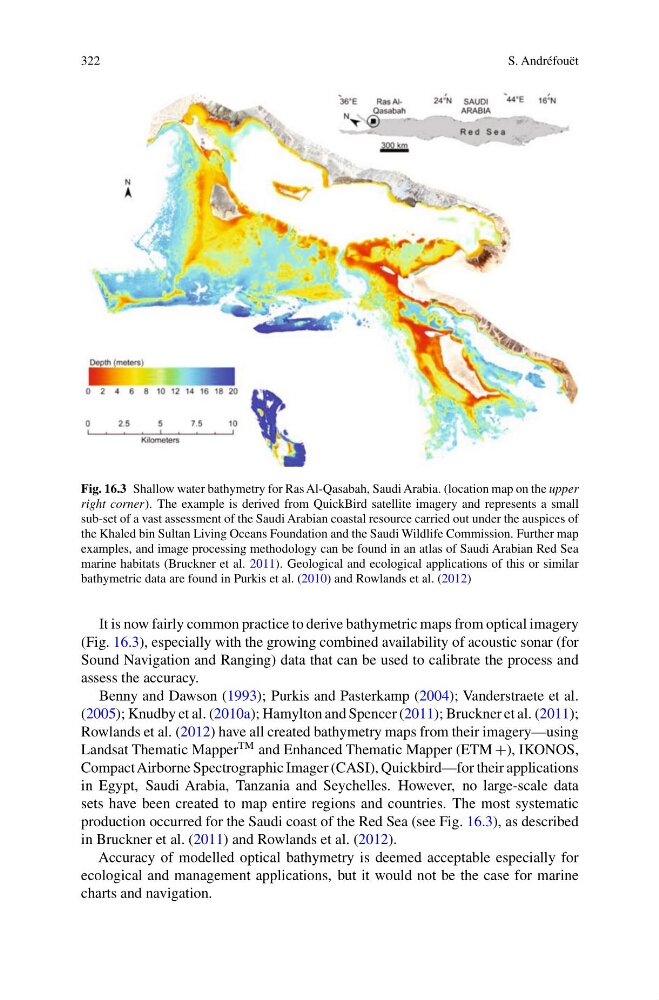
Fig. 16.3 Shallow water bathymetry for Ras Al-Qasabah, Saudi Arabia. (location map on the upper
right corner). The example is derived from QuickBird satellite imagery and represents a small
sub-set of a vast assessment of the Saudi Arabian coastal resource carried out under the auspices of
the Khaled bin Sultan Living Oceans Foundation and the Saudi Wildlife Commission. Further map
examples, and image processing methodology can be found in an atlas of Saudi Arabian Red Sea
marine habitats (Bruckner et al. 2011). Geological and ecological applications of this or similar
bathymetric data are found in Purkis et al. (2010) and Rowlands et al. (2012)
It is now fairly common practice to derive bathymetric maps from optical imagery
(Fig. 16.3), especially with the growing combined availability of acoustic sonar (for
Sound Navigation and Ranging) data that can be used to calibrate the process and
assess the accuracy.
Benny and Dawson (1993); Purkis and Pasterkamp (2004); Vanderstraete et al.
(2005); Knudby et al. (2010a); Hamylton and Spencer (2011); Bruckner et al. (2011);
Rowlands et al. (2012) have all created bathymetry maps from their imagery—using
Landsat Thematic Mapper
TM and Enhanced Thematic Mapper (ETM +), IKONOS,
Compact Airborne Spectrographic Imager (CASI), Quickbird—for their applications
in Egypt, Saudi Arabia, Tanzania and Seychelles. However, no large-scale data
sets have been created to map entire regions and countries. The most systematic
production occurred for the Saudi coast of the Red Sea (see Fig. 16.3), as described
in Bruckner et al. (2011) and Rowlands et al. (2012).
Accuracy of modelled optical bathymetry is deemed acceptable especially for
ecological and management applications, but it would not be the case for marine
charts and navigation.
S. Andréfouët
Fig. 16.3 Shallow water bathymetry for Ras Al-Qasabah, Saudi Arabia. (location map on the upper
right corner). The example is derived from QuickBird satellite imagery and represents a small
sub-set of a vast assessment of the Saudi Arabian coastal resource carried out under the auspices of
the Khaled bin Sultan Living Oceans Foundation and the Saudi Wildlife Commission. Further map
examples, and image processing methodology can be found in an atlas of Saudi Arabian Red Sea
marine habitats (Bruckner et al. 2011). Geological and ecological applications of this or similar
bathymetric data are found in Purkis et al. (2010) and Rowlands et al. (2012)
It is now fairly common practice to derive bathymetric maps from optical imagery
(Fig. 16.3), especially with the growing combined availability of acoustic sonar (for
Sound Navigation and Ranging) data that can be used to calibrate the process and
assess the accuracy.
Benny and Dawson (1993); Purkis and Pasterkamp (2004); Vanderstraete et al.
(2005); Knudby et al. (2010a); Hamylton and Spencer (2011); Bruckner et al. (2011);
Rowlands et al. (2012) have all created bathymetry maps from their imagery—using
Landsat Thematic Mapper
TM and Enhanced Thematic Mapper (ETM +), IKONOS,
Compact Airborne Spectrographic Imager (CASI), Quickbird—for their applications
in Egypt, Saudi Arabia, Tanzania and Seychelles. However, no large-scale data
sets have been created to map entire regions and countries. The most systematic
production occurred for the Saudi coast of the Red Sea (see Fig. 16.3), as described
in Bruckner et al. (2011) and Rowlands et al. (2012).
Accuracy of modelled optical bathymetry is deemed acceptable especially for
ecological and management applications, but it would not be the case for marine
charts and navigation.