

14 Internal Solitary Waves System in the Mozambique Channel
271
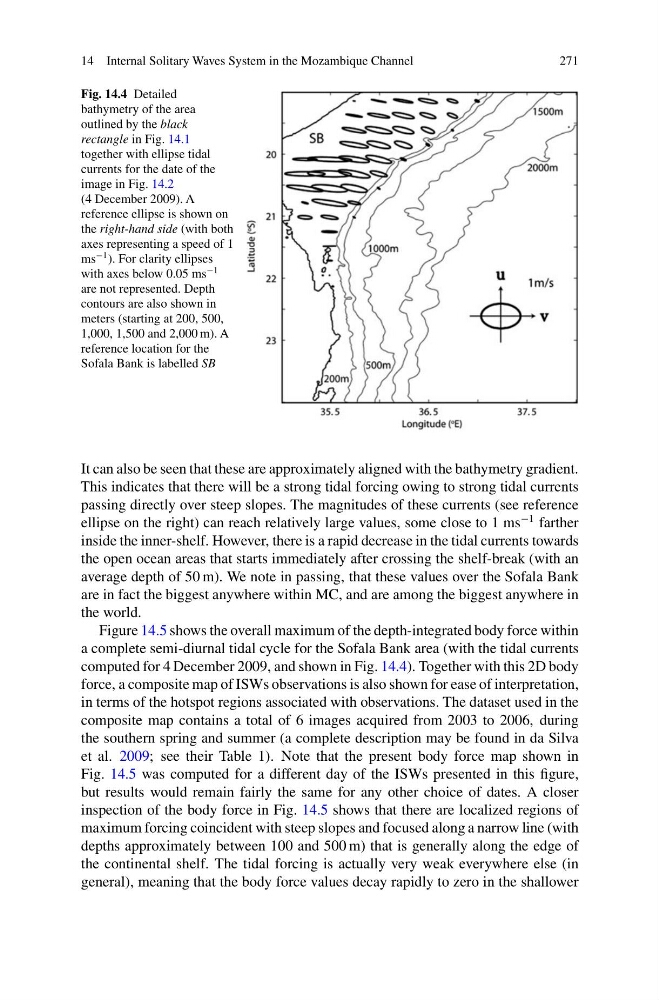
Fig. 14.4 Detailed
bathymetry of the area
outlined by the black
rectangle in Fig. 14.1
together with ellipse tidal
currents for the date of the
image in Fig. 14.2
(4 December 2009). A
reference ellipse is shown on
the right-hand side (with both
axes representing a speed of 1
ms
−1 ). For clarity ellipses
with axes below 0.05 ms
−1
are not represented. Depth
contours are also shown in
meters (starting at 200, 500,
1,000, 1,500 and 2,000 m). A
reference location for the
Sofala Bank is labelled SB
It can also be seen that these are approximately aligned with the bathymetry gradient.
This indicates that there will be a strong tidal forcing owing to strong tidal currents
passing directly over steep slopes. The magnitudes of these currents (see reference
ellipse on the right) can reach relatively large values, some close to 1 ms
−1 farther
inside the inner-shelf. However, there is a rapid decrease in the tidal currents towards
the open ocean areas that starts immediately after crossing the shelf-break (with an
average depth of 50 m). We note in passing, that these values over the Sofala Bank
are in fact the biggest anywhere within MC, and are among the biggest anywhere in
the world.
Figure 14.5 shows the overall maximum of the depth-integrated body force within
a complete semi-diurnal tidal cycle for the Sofala Bank area (with the tidal currents
computed for 4 December 2009, and shown in Fig. 14.4). Together with this 2D body
force, a composite map of ISWs observations is also shown for ease of interpretation,
in terms of the hotspot regions associated with observations. The dataset used in the
composite map contains a total of 6 images acquired from 2003 to 2006, during
the southern spring and summer (a complete description may be found in da Silva
et al. 2009; see their Table 1). Note that the present body force map shown in
Fig. 14.5 was computed for a different day of the ISWs presented in this figure,
but results would remain fairly the same for any other choice of dates. A closer
inspection of the body force in Fig. 14.5 shows that there are localized regions of
maximum forcing coincident with steep slopes and focused along a narrow line (with
depths approximately between 100 and 500 m) that is generally along the edge of
the continental shelf. The tidal forcing is actually very weak everywhere else (in
general), meaning that the body force values decay rapidly to zero in the shallower
271
Fig. 14.4 Detailed
bathymetry of the area
outlined by the black
rectangle in Fig. 14.1
together with ellipse tidal
currents for the date of the
image in Fig. 14.2
(4 December 2009). A
reference ellipse is shown on
the right-hand side (with both
axes representing a speed of 1
ms
−1 ). For clarity ellipses
with axes below 0.05 ms
−1
are not represented. Depth
contours are also shown in
meters (starting at 200, 500,
1,000, 1,500 and 2,000 m). A
reference location for the
Sofala Bank is labelled SB
It can also be seen that these are approximately aligned with the bathymetry gradient.
This indicates that there will be a strong tidal forcing owing to strong tidal currents
passing directly over steep slopes. The magnitudes of these currents (see reference
ellipse on the right) can reach relatively large values, some close to 1 ms
−1 farther
inside the inner-shelf. However, there is a rapid decrease in the tidal currents towards
the open ocean areas that starts immediately after crossing the shelf-break (with an
average depth of 50 m). We note in passing, that these values over the Sofala Bank
are in fact the biggest anywhere within MC, and are among the biggest anywhere in
the world.
Figure 14.5 shows the overall maximum of the depth-integrated body force within
a complete semi-diurnal tidal cycle for the Sofala Bank area (with the tidal currents
computed for 4 December 2009, and shown in Fig. 14.4). Together with this 2D body
force, a composite map of ISWs observations is also shown for ease of interpretation,
in terms of the hotspot regions associated with observations. The dataset used in the
composite map contains a total of 6 images acquired from 2003 to 2006, during
the southern spring and summer (a complete description may be found in da Silva
et al. 2009; see their Table 1). Note that the present body force map shown in
Fig. 14.5 was computed for a different day of the ISWs presented in this figure,
but results would remain fairly the same for any other choice of dates. A closer
inspection of the body force in Fig. 14.5 shows that there are localized regions of
maximum forcing coincident with steep slopes and focused along a narrow line (with
depths approximately between 100 and 500 m) that is generally along the edge of
the continental shelf. The tidal forcing is actually very weak everywhere else (in
general), meaning that the body force values decay rapidly to zero in the shallower