

260
J. A. Johannessen et al.
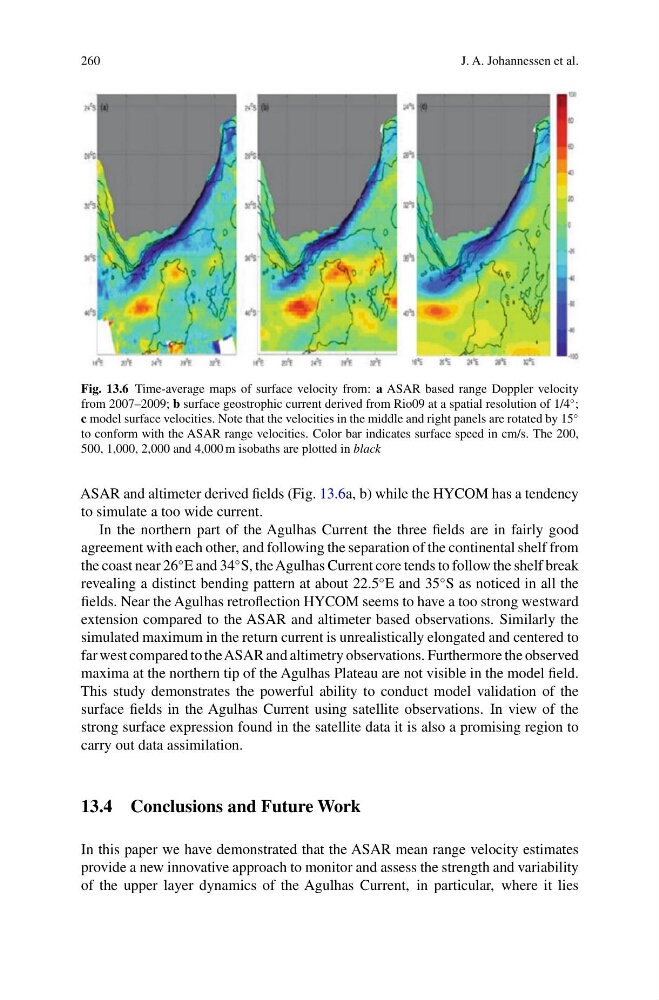
Fig. 13.6 Time-average maps of surface velocity from: a ASAR based range Doppler velocity
from 2007–2009; b surface geostrophic current derived from Rio09 at a spatial resolution of 1/4
◦ ;
c model surface velocities. Note that the velocities in the middle and right panels are rotated by 15
◦
to conform with the ASAR range velocities. Color bar indicates surface speed in cm/s. The 200,
500, 1,000, 2,000 and 4,000 m isobaths are plotted in black
ASAR and altimeter derived fields (Fig. 13.6a, b) while the HYCOM has a tendency
to simulate a too wide current.
In the northern part of the Agulhas Current the three fields are in fairly good
agreement with each other, and following the separation of the continental shelf from
the coast near 26
◦ E and 34
◦ S, the Agulhas Current core tends to follow the shelf break
revealing a distinct bending pattern at about 22.5
◦ E and 35
◦ S as noticed in all the
fields. Near the Agulhas retroflection HYCOM seems to have a too strong westward
extension compared to the ASAR and altimeter based observations. Similarly the
simulated maximum in the return current is unrealistically elongated and centered to
far west compared to theASAR and altimetry observations. Furthermore the observed
maxima at the northern tip of the Agulhas Plateau are not visible in the model field.
This study demonstrates the powerful ability to conduct model validation of the
surface fields in the Agulhas Current using satellite observations. In view of the
strong surface expression found in the satellite data it is also a promising region to
carry out data assimilation.
13.4 Conclusions and Future Work
In this paper we have demonstrated that the ASAR mean range velocity estimates
provide a new innovative approach to monitor and assess the strength and variability
of the upper layer dynamics of the Agulhas Current, in particular, where it lies
J. A. Johannessen et al.
Fig. 13.6 Time-average maps of surface velocity from: a ASAR based range Doppler velocity
from 2007–2009; b surface geostrophic current derived from Rio09 at a spatial resolution of 1/4
◦ ;
c model surface velocities. Note that the velocities in the middle and right panels are rotated by 15
◦
to conform with the ASAR range velocities. Color bar indicates surface speed in cm/s. The 200,
500, 1,000, 2,000 and 4,000 m isobaths are plotted in black
ASAR and altimeter derived fields (Fig. 13.6a, b) while the HYCOM has a tendency
to simulate a too wide current.
In the northern part of the Agulhas Current the three fields are in fairly good
agreement with each other, and following the separation of the continental shelf from
the coast near 26
◦ E and 34
◦ S, the Agulhas Current core tends to follow the shelf break
revealing a distinct bending pattern at about 22.5
◦ E and 35
◦ S as noticed in all the
fields. Near the Agulhas retroflection HYCOM seems to have a too strong westward
extension compared to the ASAR and altimeter based observations. Similarly the
simulated maximum in the return current is unrealistically elongated and centered to
far west compared to theASAR and altimetry observations. Furthermore the observed
maxima at the northern tip of the Agulhas Plateau are not visible in the model field.
This study demonstrates the powerful ability to conduct model validation of the
surface fields in the Agulhas Current using satellite observations. In view of the
strong surface expression found in the satellite data it is also a promising region to
carry out data assimilation.
13.4 Conclusions and Future Work
In this paper we have demonstrated that the ASAR mean range velocity estimates
provide a new innovative approach to monitor and assess the strength and variability
of the upper layer dynamics of the Agulhas Current, in particular, where it lies