

13 Use of SAR data to Monitor the Greater Agulhas Current
259
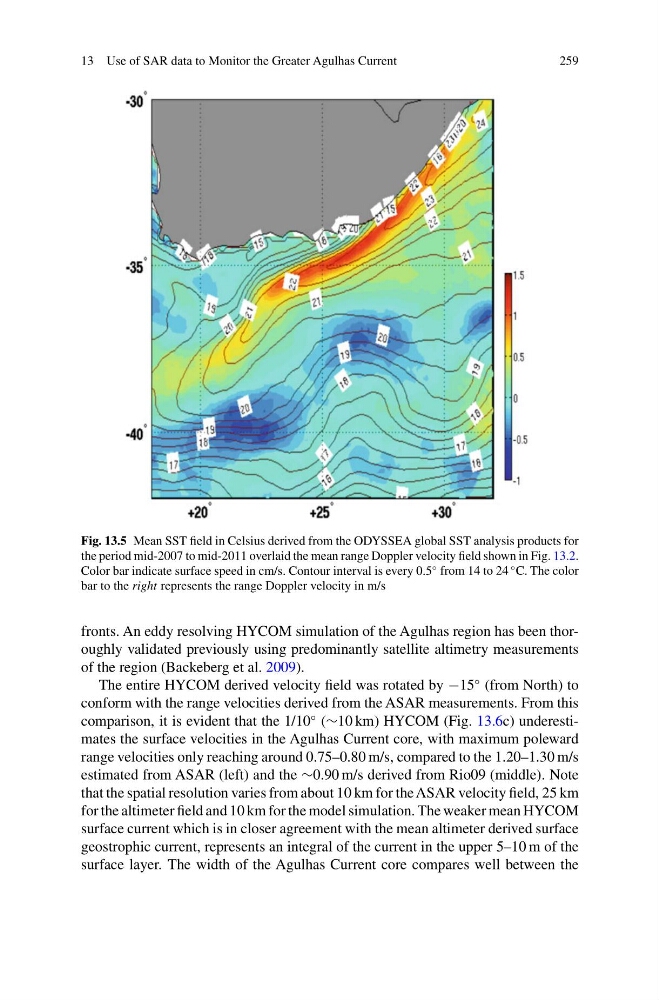
Fig. 13.5 Mean SST field in Celsius derived from the ODYSSEA global SST analysis products for
the period mid-2007 to mid-2011 overlaid the mean range Doppler velocity field shown in Fig. 13.2.
Color bar indicate surface speed in cm/s. Contour interval is every 0.5
◦ from 14 to 24
◦ C. The color
bar to the right represents the range Doppler velocity in m/s
fronts. An eddy resolving HYCOM simulation of the Agulhas region has been thoroughly validated previously using predominantly satellite altimetry measurements
of the region (Backeberg et al. 2009).
The entire HYCOM derived velocity field was rotated by −15
◦ (from North) to
conform with the range velocities derived from the ASAR measurements. From this
comparison, it is evident that the 1/10
◦ (∼10 km) HYCOM (Fig. 13.6c) underestimates the surface velocities in the Agulhas Current core, with maximum poleward
range velocities only reaching around 0.75–0.80 m/s, compared to the 1.20–1.30 m/s
estimated from ASAR (left) and the ∼0.90 m/s derived from Rio09 (middle). Note
that the spatial resolution varies from about 10 km for the ASAR velocity field, 25 km
for the altimeter field and 10 km for the model simulation. The weaker mean HYCOM
surface current which is in closer agreement with the mean altimeter derived surface
geostrophic current, represents an integral of the current in the upper 5–10 m of the
surface layer. The width of the Agulhas Current core compares well between the
259
Fig. 13.5 Mean SST field in Celsius derived from the ODYSSEA global SST analysis products for
the period mid-2007 to mid-2011 overlaid the mean range Doppler velocity field shown in Fig. 13.2.
Color bar indicate surface speed in cm/s. Contour interval is every 0.5
◦ from 14 to 24
◦ C. The color
bar to the right represents the range Doppler velocity in m/s
fronts. An eddy resolving HYCOM simulation of the Agulhas region has been thoroughly validated previously using predominantly satellite altimetry measurements
of the region (Backeberg et al. 2009).
The entire HYCOM derived velocity field was rotated by −15
◦ (from North) to
conform with the range velocities derived from the ASAR measurements. From this
comparison, it is evident that the 1/10
◦ (∼10 km) HYCOM (Fig. 13.6c) underestimates the surface velocities in the Agulhas Current core, with maximum poleward
range velocities only reaching around 0.75–0.80 m/s, compared to the 1.20–1.30 m/s
estimated from ASAR (left) and the ∼0.90 m/s derived from Rio09 (middle). Note
that the spatial resolution varies from about 10 km for the ASAR velocity field, 25 km
for the altimeter field and 10 km for the model simulation. The weaker mean HYCOM
surface current which is in closer agreement with the mean altimeter derived surface
geostrophic current, represents an integral of the current in the upper 5–10 m of the
surface layer. The width of the Agulhas Current core compares well between the