

13 Use of SAR data to Monitor the Greater Agulhas Current
257
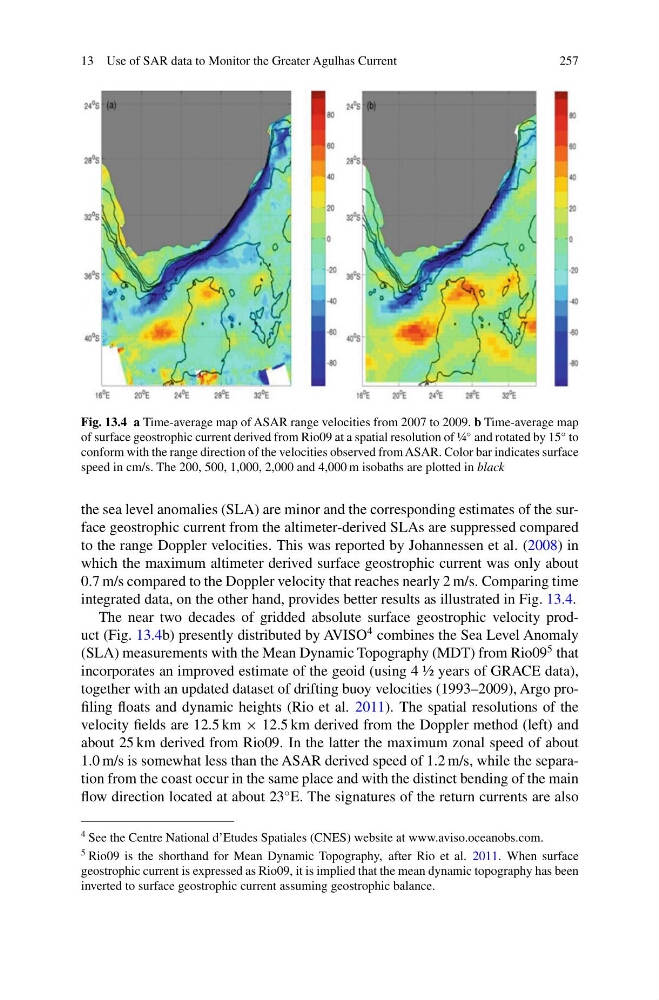
Fig. 13.4 a Time-average map of ASAR range velocities from 2007 to 2009. b Time-average map
of surface geostrophic current derived from Rio09 at a spatial resolution of ¼
◦ and rotated by 15
◦ to
conform with the range direction of the velocities observed from ASAR. Color bar indicates surface
speed in cm/s. The 200, 500, 1,000, 2,000 and 4,000 m isobaths are plotted in black
the sea level anomalies (SLA) are minor and the corresponding estimates of the surface geostrophic current from the altimeter-derived SLAs are suppressed compared
to the range Doppler velocities. This was reported by Johannessen et al. (2008) in
which the maximum altimeter derived surface geostrophic current was only about
0.7 m/s compared to the Doppler velocity that reaches nearly 2 m/s. Comparing time
integrated data, on the other hand, provides better results as illustrated in Fig. 13.4.
The near two decades of gridded absolute surface geostrophic velocity product (Fig. 13.4b) presently distributed by AVISO
4 combines the Sea Level Anomaly
(SLA) measurements with the Mean Dynamic Topography (MDT) from Rio09
5 that
incorporates an improved estimate of the geoid (using 4 ½ years of GRACE data),
together with an updated dataset of drifting buoy velocities (1993–2009), Argo profiling floats and dynamic heights (Rio et al. 2011). The spatial resolutions of the
velocity fields are 12.5 km × 12.5 km derived from the Doppler method (left) and
about 25 km derived from Rio09. In the latter the maximum zonal speed of about
1.0 m/s is somewhat less than the ASAR derived speed of 1.2 m/s, while the separation from the coast occur in the same place and with the distinct bending of the main
flow direction located at about 23
◦ E. The signatures of the return currents are also
4 See the Centre National d’Etudes Spatiales (CNES) website at www.aviso.oceanobs.com.
5 Rio09 is the shorthand for Mean Dynamic Topography, after Rio et al. 2011. When surface
geostrophic current is expressed as Rio09, it is implied that the mean dynamic topography has been
inverted to surface geostrophic current assuming geostrophic balance.
257
Fig. 13.4 a Time-average map of ASAR range velocities from 2007 to 2009. b Time-average map
of surface geostrophic current derived from Rio09 at a spatial resolution of ¼
◦ and rotated by 15
◦ to
conform with the range direction of the velocities observed from ASAR. Color bar indicates surface
speed in cm/s. The 200, 500, 1,000, 2,000 and 4,000 m isobaths are plotted in black
the sea level anomalies (SLA) are minor and the corresponding estimates of the surface geostrophic current from the altimeter-derived SLAs are suppressed compared
to the range Doppler velocities. This was reported by Johannessen et al. (2008) in
which the maximum altimeter derived surface geostrophic current was only about
0.7 m/s compared to the Doppler velocity that reaches nearly 2 m/s. Comparing time
integrated data, on the other hand, provides better results as illustrated in Fig. 13.4.
The near two decades of gridded absolute surface geostrophic velocity product (Fig. 13.4b) presently distributed by AVISO
4 combines the Sea Level Anomaly
(SLA) measurements with the Mean Dynamic Topography (MDT) from Rio09
5 that
incorporates an improved estimate of the geoid (using 4 ½ years of GRACE data),
together with an updated dataset of drifting buoy velocities (1993–2009), Argo profiling floats and dynamic heights (Rio et al. 2011). The spatial resolutions of the
velocity fields are 12.5 km × 12.5 km derived from the Doppler method (left) and
about 25 km derived from Rio09. In the latter the maximum zonal speed of about
1.0 m/s is somewhat less than the ASAR derived speed of 1.2 m/s, while the separation from the coast occur in the same place and with the distinct bending of the main
flow direction located at about 23
◦ E. The signatures of the return currents are also
4 See the Centre National d’Etudes Spatiales (CNES) website at www.aviso.oceanobs.com.
5 Rio09 is the shorthand for Mean Dynamic Topography, after Rio et al. 2011. When surface
geostrophic current is expressed as Rio09, it is implied that the mean dynamic topography has been
inverted to surface geostrophic current assuming geostrophic balance.