

256
J. A. Johannessen et al.
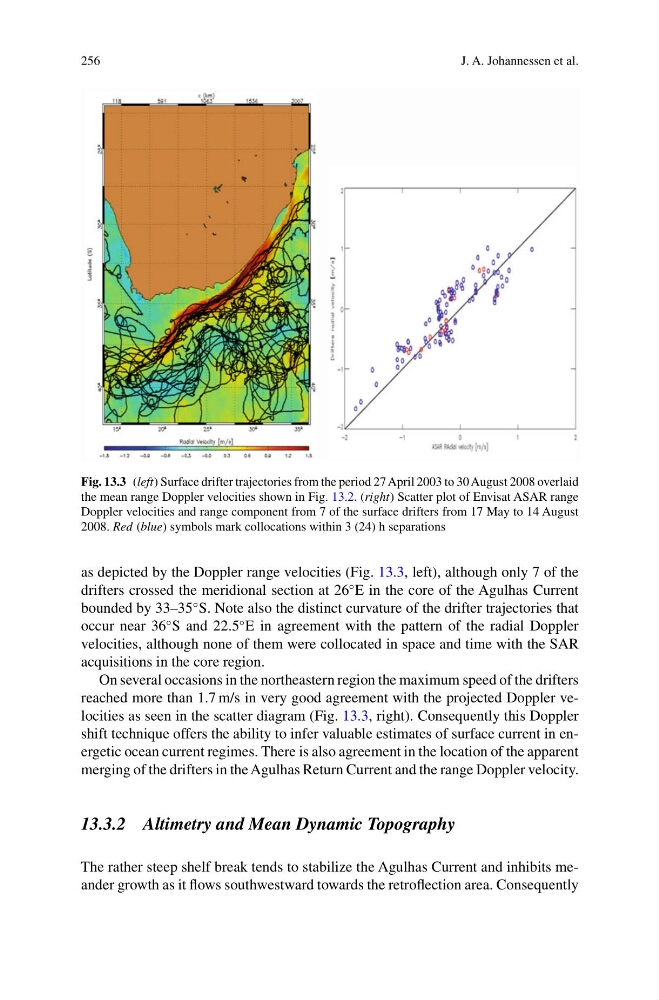
Fig. 13.3 (left) Surface drifter trajectories from the period 27 April 2003 to 30 August 2008 overlaid
the mean range Doppler velocities shown in Fig. 13.2. (right) Scatter plot of Envisat ASAR range
Doppler velocities and range component from 7 of the surface drifters from 17 May to 14 August
2008. Red (blue) symbols mark collocations within 3 (24) h separations
as depicted by the Doppler range velocities (Fig. 13.3, left), although only 7 of the
drifters crossed the meridional section at 26
◦ E in the core of the Agulhas Current
bounded by 33–35
◦ S. Note also the distinct curvature of the drifter trajectories that
occur near 36
◦ S and 22.5
◦ E in agreement with the pattern of the radial Doppler
velocities, although none of them were collocated in space and time with the SAR
acquisitions in the core region.
On several occasions in the northeastern region the maximum speed of the drifters
reached more than 1.7 m/s in very good agreement with the projected Doppler velocities as seen in the scatter diagram (Fig. 13.3, right). Consequently this Doppler
shift technique offers the ability to infer valuable estimates of surface current in energetic ocean current regimes. There is also agreement in the location of the apparent
merging of the drifters in the Agulhas Return Current and the range Doppler velocity.
13.3.2 Altimetry and Mean Dynamic Topography
The rather steep shelf break tends to stabilize the Agulhas Current and inhibits meander growth as it flows southwestward towards the retroflection area. Consequently
J. A. Johannessen et al.
Fig. 13.3 (left) Surface drifter trajectories from the period 27 April 2003 to 30 August 2008 overlaid
the mean range Doppler velocities shown in Fig. 13.2. (right) Scatter plot of Envisat ASAR range
Doppler velocities and range component from 7 of the surface drifters from 17 May to 14 August
2008. Red (blue) symbols mark collocations within 3 (24) h separations
as depicted by the Doppler range velocities (Fig. 13.3, left), although only 7 of the
drifters crossed the meridional section at 26
◦ E in the core of the Agulhas Current
bounded by 33–35
◦ S. Note also the distinct curvature of the drifter trajectories that
occur near 36
◦ S and 22.5
◦ E in agreement with the pattern of the radial Doppler
velocities, although none of them were collocated in space and time with the SAR
acquisitions in the core region.
On several occasions in the northeastern region the maximum speed of the drifters
reached more than 1.7 m/s in very good agreement with the projected Doppler velocities as seen in the scatter diagram (Fig. 13.3, right). Consequently this Doppler
shift technique offers the ability to infer valuable estimates of surface current in energetic ocean current regimes. There is also agreement in the location of the apparent
merging of the drifters in the Agulhas Return Current and the range Doppler velocity.
13.3.2 Altimetry and Mean Dynamic Topography
The rather steep shelf break tends to stabilize the Agulhas Current and inhibits meander growth as it flows southwestward towards the retroflection area. Consequently