

240
M. Krug et al.
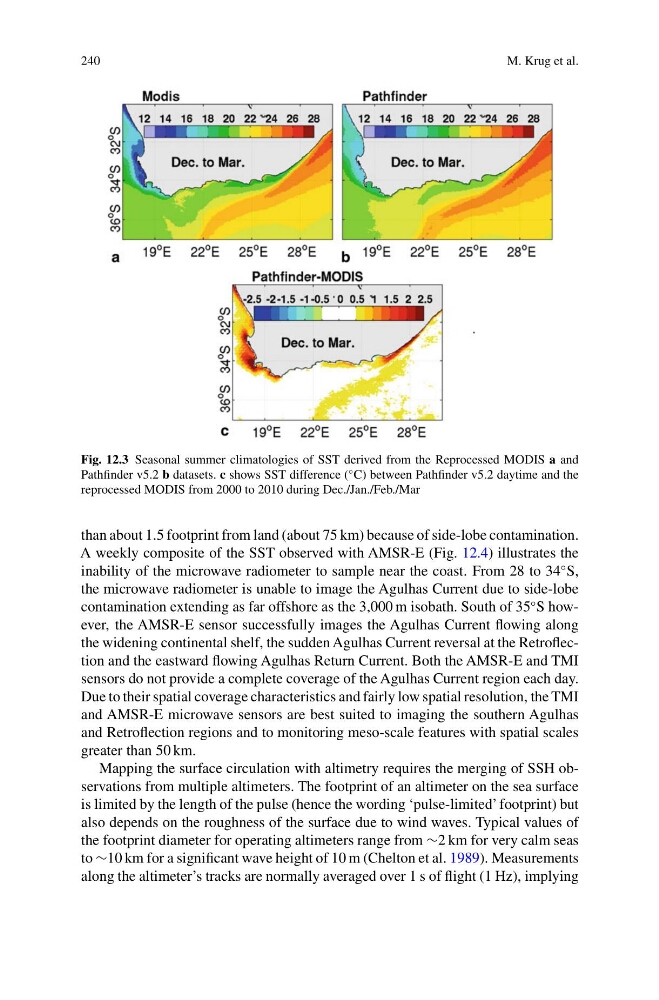
Fig. 12.3 Seasonal summer climatologies of SST derived from the Reprocessed MODIS a and
Pathfinder v5.2 b datasets. c shows SST difference (
◦ C) between Pathfinder v5.2 daytime and the
reprocessed MODIS from 2000 to 2010 during Dec./Jan./Feb./Mar
than about 1.5 footprint from land (about 75 km) because of side-lobe contamination.
A weekly composite of the SST observed with AMSR-E (Fig. 12.4) illustrates the
inability of the microwave radiometer to sample near the coast. From 28 to 34
◦ S,
the microwave radiometer is unable to image the Agulhas Current due to side-lobe
contamination extending as far offshore as the 3,000 m isobath. South of 35
◦ S however, the AMSR-E sensor successfully images the Agulhas Current flowing along
the widening continental shelf, the sudden Agulhas Current reversal at the Retroflection and the eastward flowing Agulhas Return Current. Both the AMSR-E and TMI
sensors do not provide a complete coverage of the Agulhas Current region each day.
Due to their spatial coverage characteristics and fairly low spatial resolution, the TMI
and AMSR-E microwave sensors are best suited to imaging the southern Agulhas
and Retroflection regions and to monitoring meso-scale features with spatial scales
greater than 50 km.
Mapping the surface circulation with altimetry requires the merging of SSH observations from multiple altimeters. The footprint of an altimeter on the sea surface
is limited by the length of the pulse (hence the wording ‘pulse-limited’ footprint) but
also depends on the roughness of the surface due to wind waves. Typical values of
the footprint diameter for operating altimeters range from ∼2 km for very calm seas
to ∼10 km for a significant wave height of 10 m (Chelton et al. 1989). Measurements
along the altimeter’s tracks are normally averaged over 1 s of flight (1 Hz), implying
M. Krug et al.
Fig. 12.3 Seasonal summer climatologies of SST derived from the Reprocessed MODIS a and
Pathfinder v5.2 b datasets. c shows SST difference (
◦ C) between Pathfinder v5.2 daytime and the
reprocessed MODIS from 2000 to 2010 during Dec./Jan./Feb./Mar
than about 1.5 footprint from land (about 75 km) because of side-lobe contamination.
A weekly composite of the SST observed with AMSR-E (Fig. 12.4) illustrates the
inability of the microwave radiometer to sample near the coast. From 28 to 34
◦ S,
the microwave radiometer is unable to image the Agulhas Current due to side-lobe
contamination extending as far offshore as the 3,000 m isobath. South of 35
◦ S however, the AMSR-E sensor successfully images the Agulhas Current flowing along
the widening continental shelf, the sudden Agulhas Current reversal at the Retroflection and the eastward flowing Agulhas Return Current. Both the AMSR-E and TMI
sensors do not provide a complete coverage of the Agulhas Current region each day.
Due to their spatial coverage characteristics and fairly low spatial resolution, the TMI
and AMSR-E microwave sensors are best suited to imaging the southern Agulhas
and Retroflection regions and to monitoring meso-scale features with spatial scales
greater than 50 km.
Mapping the surface circulation with altimetry requires the merging of SSH observations from multiple altimeters. The footprint of an altimeter on the sea surface
is limited by the length of the pulse (hence the wording ‘pulse-limited’ footprint) but
also depends on the roughness of the surface due to wind waves. Typical values of
the footprint diameter for operating altimeters range from ∼2 km for very calm seas
to ∼10 km for a significant wave height of 10 m (Chelton et al. 1989). Measurements
along the altimeter’s tracks are normally averaged over 1 s of flight (1 Hz), implying