

216
W. Alpers et al.
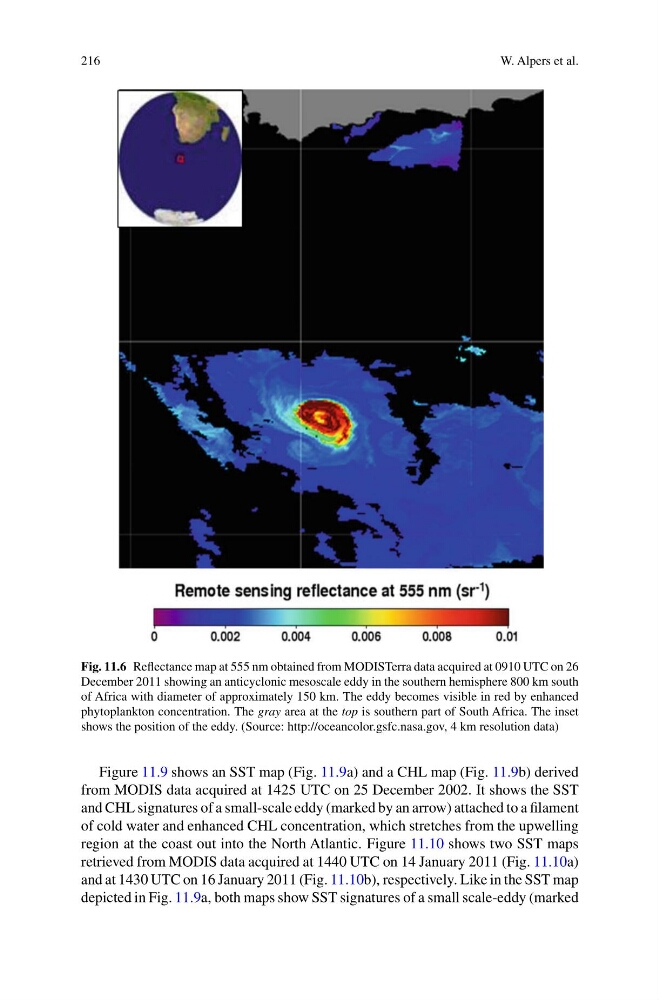
Fig. 11.6 Reflectance map at 555 nm obtained from MODISTerra data acquired at 0910 UTC on 26
December 2011 showing an anticyclonic mesoscale eddy in the southern hemisphere 800 km south
of Africa with diameter of approximately 150 km. The eddy becomes visible in red by enhanced
phytoplankton concentration. The gray area at the top is southern part of South Africa. The inset
shows the position of the eddy. (Source: http://oceancolor.gsfc.nasa.gov, 4 km resolution data)
Figure 11.9 shows an SST map (Fig. 11.9a) and a CHL map (Fig. 11.9b) derived
from MODIS data acquired at 1425 UTC on 25 December 2002. It shows the SST
and CHL signatures of a small-scale eddy (marked by an arrow) attached to a filament
of cold water and enhanced CHL concentration, which stretches from the upwelling
region at the coast out into the North Atlantic. Figure 11.10 shows two SST maps
retrieved from MODIS data acquired at 1440 UTC on 14 January 2011 (Fig. 11.10a)
and at 1430 UTC on 16 January 2011 (Fig. 11.10b), respectively. Like in the SST map
depicted in Fig. 11.9a, both maps show SST signatures of a small scale-eddy (marked
W. Alpers et al.
Fig. 11.6 Reflectance map at 555 nm obtained from MODISTerra data acquired at 0910 UTC on 26
December 2011 showing an anticyclonic mesoscale eddy in the southern hemisphere 800 km south
of Africa with diameter of approximately 150 km. The eddy becomes visible in red by enhanced
phytoplankton concentration. The gray area at the top is southern part of South Africa. The inset
shows the position of the eddy. (Source: http://oceancolor.gsfc.nasa.gov, 4 km resolution data)
Figure 11.9 shows an SST map (Fig. 11.9a) and a CHL map (Fig. 11.9b) derived
from MODIS data acquired at 1425 UTC on 25 December 2002. It shows the SST
and CHL signatures of a small-scale eddy (marked by an arrow) attached to a filament
of cold water and enhanced CHL concentration, which stretches from the upwelling
region at the coast out into the North Atlantic. Figure 11.10 shows two SST maps
retrieved from MODIS data acquired at 1440 UTC on 14 January 2011 (Fig. 11.10a)
and at 1430 UTC on 16 January 2011 (Fig. 11.10b), respectively. Like in the SST map
depicted in Fig. 11.9a, both maps show SST signatures of a small scale-eddy (marked