

11 Satellite Observations of Oceanic Eddies Around Africa
213
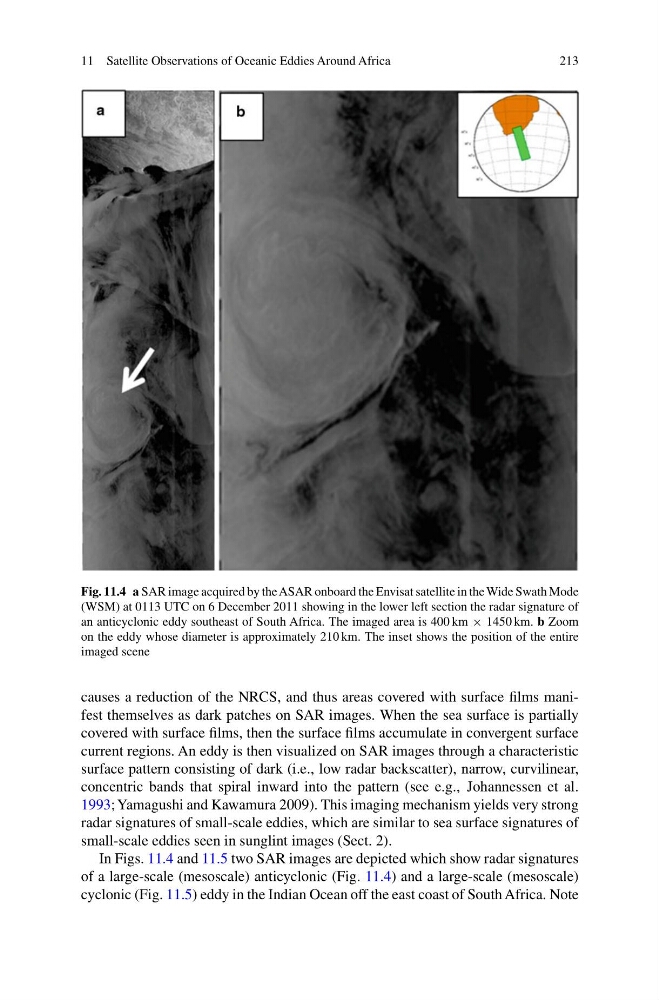
Fig. 11.4 a SAR image acquired by the ASAR onboard the Envisat satellite in the Wide Swath Mode
(WSM) at 0113 UTC on 6 December 2011 showing in the lower left section the radar signature of
an anticyclonic eddy southeast of South Africa. The imaged area is 400 km × 1450 km. b Zoom
on the eddy whose diameter is approximately 210 km. The inset shows the position of the entire
imaged scene
causes a reduction of the NRCS, and thus areas covered with surface films manifest themselves as dark patches on SAR images. When the sea surface is partially
covered with surface films, then the surface films accumulate in convergent surface
current regions. An eddy is then visualized on SAR images through a characteristic
surface pattern consisting of dark (i.e., low radar backscatter), narrow, curvilinear,
concentric bands that spiral inward into the pattern (see e.g., Johannessen et al.
1993; Yamagushi and Kawamura 2009). This imaging mechanism yields very strong
radar signatures of small-scale eddies, which are similar to sea surface signatures of
small-scale eddies seen in sunglint images (Sect. 2).
In Figs. 11.4 and 11.5 two SAR images are depicted which show radar signatures
of a large-scale (mesoscale) anticyclonic (Fig. 11.4) and a large-scale (mesoscale)
cyclonic (Fig. 11.5) eddy in the Indian Ocean off the east coast of South Africa. Note
213
Fig. 11.4 a SAR image acquired by the ASAR onboard the Envisat satellite in the Wide Swath Mode
(WSM) at 0113 UTC on 6 December 2011 showing in the lower left section the radar signature of
an anticyclonic eddy southeast of South Africa. The imaged area is 400 km × 1450 km. b Zoom
on the eddy whose diameter is approximately 210 km. The inset shows the position of the entire
imaged scene
causes a reduction of the NRCS, and thus areas covered with surface films manifest themselves as dark patches on SAR images. When the sea surface is partially
covered with surface films, then the surface films accumulate in convergent surface
current regions. An eddy is then visualized on SAR images through a characteristic
surface pattern consisting of dark (i.e., low radar backscatter), narrow, curvilinear,
concentric bands that spiral inward into the pattern (see e.g., Johannessen et al.
1993; Yamagushi and Kawamura 2009). This imaging mechanism yields very strong
radar signatures of small-scale eddies, which are similar to sea surface signatures of
small-scale eddies seen in sunglint images (Sect. 2).
In Figs. 11.4 and 11.5 two SAR images are depicted which show radar signatures
of a large-scale (mesoscale) anticyclonic (Fig. 11.4) and a large-scale (mesoscale)
cyclonic (Fig. 11.5) eddy in the Indian Ocean off the east coast of South Africa. Note