

142
E. V. Djagoua et al.
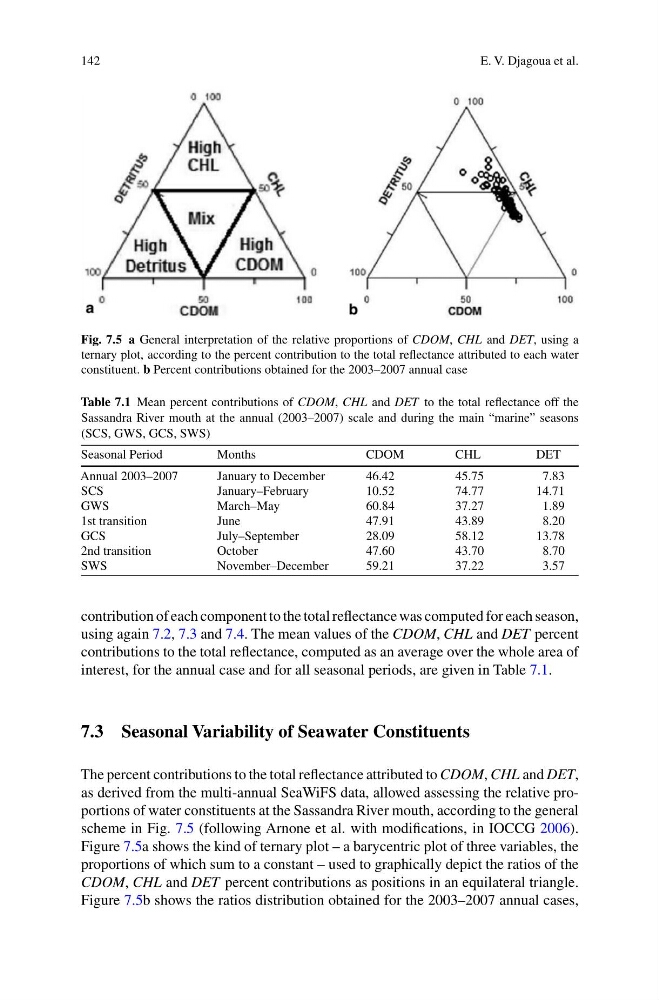
Fig. 7.5 a General interpretation of the relative proportions of CDOM, CHL and DET, using a
ternary plot, according to the percent contribution to the total reflectance attributed to each water
constituent. b Percent contributions obtained for the 2003–2007 annual case
Table 7.1 Mean percent contributions of CDOM, CHL and DET to the total reflectance off the
Sassandra River mouth at the annual (2003–2007) scale and during the main “marine” seasons
(SCS, GWS, GCS, SWS)
Seasonal Period
Months
CDOM
CHL
DET
Annual 2003–2007
January to December
46.42
45.75
7.83
SCS
January–February
10.52
74.77
14.71
GWS
March–May
60.84
37.27
1.89
1st transition
June
47.91
43.89
8.20
GCS
July–September
28.09
58.12
13.78
2nd transition
October
47.60
43.70
8.70
SWS
November–December
59.21
37.22
3.57
contribution of each component to the total reflectance was computed for each season,
using again 7.2, 7.3 and 7.4. The mean values of the CDOM, CHL and DET percent
contributions to the total reflectance, computed as an average over the whole area of
interest, for the annual case and for all seasonal periods, are given in Table 7.1.
7.3 Seasonal Variability of Seawater Constituents
The percent contributions to the total reflectance attributed to CDOM, CHL and DET,
as derived from the multi-annual SeaWiFS data, allowed assessing the relative proportions of water constituents at the Sassandra River mouth, according to the general
scheme in Fig. 7.5 (following Arnone et al. with modifications, in IOCCG 2006).
Figure 7.5a shows the kind of ternary plot – a barycentric plot of three variables, the
proportions of which sum to a constant – used to graphically depict the ratios of the
CDOM, CHL and DET percent contributions as positions in an equilateral triangle.
Figure 7.5b shows the ratios distribution obtained for the 2003–2007 annual cases,
E. V. Djagoua et al.
Fig. 7.5 a General interpretation of the relative proportions of CDOM, CHL and DET, using a
ternary plot, according to the percent contribution to the total reflectance attributed to each water
constituent. b Percent contributions obtained for the 2003–2007 annual case
Table 7.1 Mean percent contributions of CDOM, CHL and DET to the total reflectance off the
Sassandra River mouth at the annual (2003–2007) scale and during the main “marine” seasons
(SCS, GWS, GCS, SWS)
Seasonal Period
Months
CDOM
CHL
DET
Annual 2003–2007
January to December
46.42
45.75
7.83
SCS
January–February
10.52
74.77
14.71
GWS
March–May
60.84
37.27
1.89
1st transition
June
47.91
43.89
8.20
GCS
July–September
28.09
58.12
13.78
2nd transition
October
47.60
43.70
8.70
SWS
November–December
59.21
37.22
3.57
contribution of each component to the total reflectance was computed for each season,
using again 7.2, 7.3 and 7.4. The mean values of the CDOM, CHL and DET percent
contributions to the total reflectance, computed as an average over the whole area of
interest, for the annual case and for all seasonal periods, are given in Table 7.1.
7.3 Seasonal Variability of Seawater Constituents
The percent contributions to the total reflectance attributed to CDOM, CHL and DET,
as derived from the multi-annual SeaWiFS data, allowed assessing the relative proportions of water constituents at the Sassandra River mouth, according to the general
scheme in Fig. 7.5 (following Arnone et al. with modifications, in IOCCG 2006).
Figure 7.5a shows the kind of ternary plot – a barycentric plot of three variables, the
proportions of which sum to a constant – used to graphically depict the ratios of the
CDOM, CHL and DET percent contributions as positions in an equilateral triangle.
Figure 7.5b shows the ratios distribution obtained for the 2003–2007 annual cases,