

7 Water Constituents Assessment at the Sassandra River Mouth (Côte d’Ivoire)
141
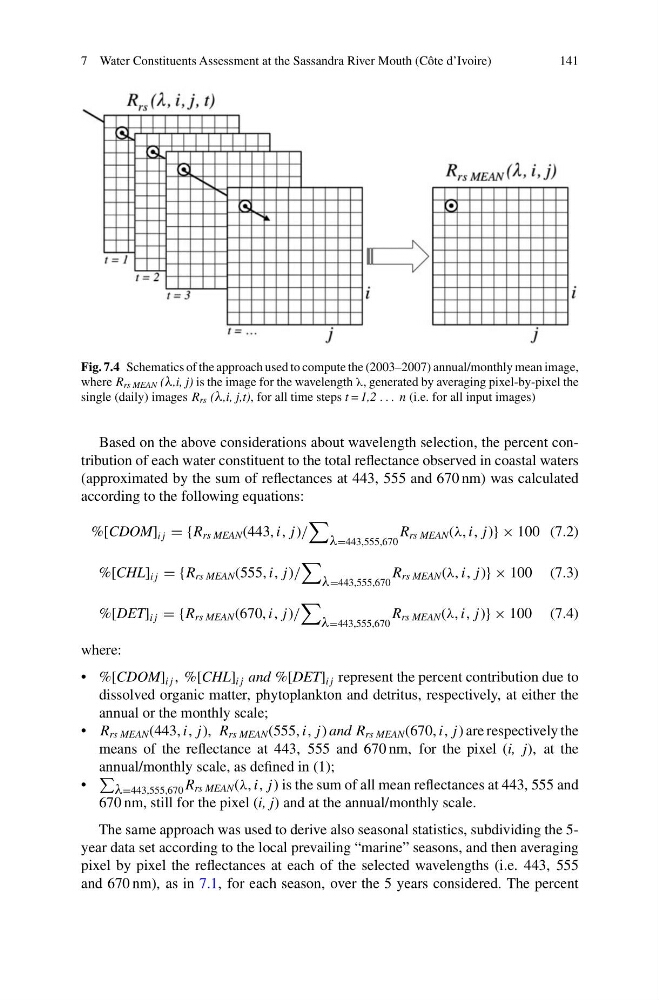
Fig. 7.4 Schematics of the approach used to compute the (2003–2007) annual/monthly mean image,
where R rs MEAN (λ,i, j) is the image for the wavelength λ, generated by averaging pixel-by-pixel the
single (daily) images R rs (λ,i, j,t), for all time steps t = 1,2 . . . n (i.e. for all input images)
Based on the above considerations about wavelength selection, the percent contribution of each water constituent to the total reflectance observed in coastal waters
(approximated by the sum of reflectances at 443, 555 and 670 nm) was calculated
according to the following equations:
%[CDOM] ij = {R rs MEAN (443, i, j )/
λ=443,555,670
R rs MEAN (λ, i, j )} × 100 (7.2)
%[CHL] ij = {R rs MEAN (555, i, j )/
λ=443,555,670
R rs MEAN (λ, i, j )} × 100 (7.3)
%[DET] ij = {R rs MEAN (670, i, j )/
λ=443,555,670
R rs MEAN (λ, i, j )} × 100 (7.4)
where:
• %[CDOM] ij , %[CHL] ij and %[DET] ij represent the percent contribution due to
dissolved organic matter, phytoplankton and detritus, respectively, at either the
annual or the monthly scale;
• R rs MEAN (443, i, j ), R rs MEAN (555, i, j ) and R rs MEAN (670, i, j ) are respectively the
means of the reflectance at 443, 555 and 670 nm, for the pixel (i, j), at the
annual/monthly scale, as defined in (1);
•
λ=443,555,670 R rs MEAN (λ, i, j ) is the sum of all mean reflectances at 443, 555 and
670 nm, still for the pixel (i, j) and at the annual/monthly scale.
The same approach was used to derive also seasonal statistics, subdividing the 5year data set according to the local prevailing “marine” seasons, and then averaging
pixel by pixel the reflectances at each of the selected wavelengths (i.e. 443, 555
and 670 nm), as in 7.1, for each season, over the 5 years considered. The percent
141
Fig. 7.4 Schematics of the approach used to compute the (2003–2007) annual/monthly mean image,
where R rs MEAN (λ,i, j) is the image for the wavelength λ, generated by averaging pixel-by-pixel the
single (daily) images R rs (λ,i, j,t), for all time steps t = 1,2 . . . n (i.e. for all input images)
Based on the above considerations about wavelength selection, the percent contribution of each water constituent to the total reflectance observed in coastal waters
(approximated by the sum of reflectances at 443, 555 and 670 nm) was calculated
according to the following equations:
%[CDOM] ij = {R rs MEAN (443, i, j )/
λ=443,555,670
R rs MEAN (λ, i, j )} × 100 (7.2)
%[CHL] ij = {R rs MEAN (555, i, j )/
λ=443,555,670
R rs MEAN (λ, i, j )} × 100 (7.3)
%[DET] ij = {R rs MEAN (670, i, j )/
λ=443,555,670
R rs MEAN (λ, i, j )} × 100 (7.4)
where:
• %[CDOM] ij , %[CHL] ij and %[DET] ij represent the percent contribution due to
dissolved organic matter, phytoplankton and detritus, respectively, at either the
annual or the monthly scale;
• R rs MEAN (443, i, j ), R rs MEAN (555, i, j ) and R rs MEAN (670, i, j ) are respectively the
means of the reflectance at 443, 555 and 670 nm, for the pixel (i, j), at the
annual/monthly scale, as defined in (1);
•
λ=443,555,670 R rs MEAN (λ, i, j ) is the sum of all mean reflectances at 443, 555 and
670 nm, still for the pixel (i, j) and at the annual/monthly scale.
The same approach was used to derive also seasonal statistics, subdividing the 5year data set according to the local prevailing “marine” seasons, and then averaging
pixel by pixel the reflectances at each of the selected wavelengths (i.e. 443, 555
and 670 nm), as in 7.1, for each season, over the 5 years considered. The percent