

6 Impacts of Saharan Dust on the Marine Environment in the Area . . .
125
400
400
wavelength (nm)
0
0.01
0.02
0.03
0.04
r (dimensionless)
open sea
coast
wavelength (nm)
0
0.2
0.4
0.6
k
d (m -1
)
open sea
coast
a
b
500
500
600
600
700
700
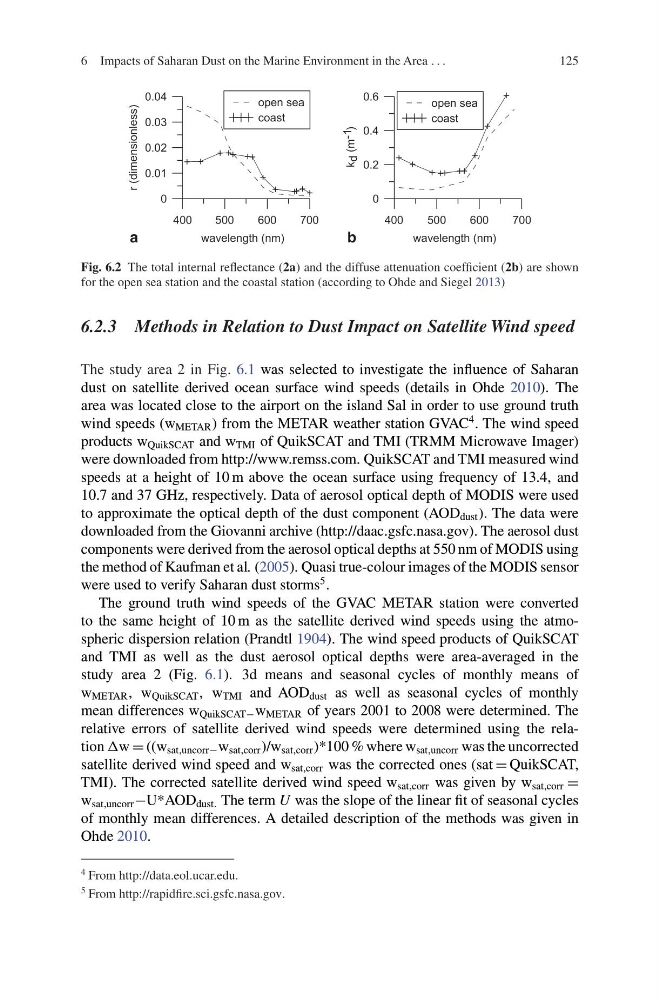
Fig. 6.2 The total internal reflectance (2a) and the diffuse attenuation coefficient (2b) are shown
for the open sea station and the coastal station (according to Ohde and Siegel 2013)
6.2.3 Methods in Relation to Dust Impact on Satellite Wind speed
The study area 2 in Fig. 6.1 was selected to investigate the influence of Saharan
dust on satellite derived ocean surface wind speeds (details in Ohde 2010). The
area was located close to the airport on the island Sal in order to use ground truth
wind speeds (w METAR ) from the METAR weather station GVAC
4 . The wind speed
products w QuikSCAT and w TMI of QuikSCAT and TMI (TRMM Microwave Imager)
were downloaded from http://www.remss.com. QuikSCAT and TMI measured wind
speeds at a height of 10 m above the ocean surface using frequency of 13.4, and
10.7 and 37 GHz, respectively. Data of aerosol optical depth of MODIS were used
to approximate the optical depth of the dust component (AOD dust ). The data were
downloaded from the Giovanni archive (http://daac.gsfc.nasa.gov). The aerosol dust
components were derived from the aerosol optical depths at 550 nm of MODIS using
the method of Kaufman et al. (2005). Quasi true-colour images of the MODIS sensor
were used to verify Saharan dust storms
5 .
The ground truth wind speeds of the GVAC METAR station were converted
to the same height of 10 m as the satellite derived wind speeds using the atmospheric dispersion relation (Prandtl 1904). The wind speed products of QuikSCAT
and TMI as well as the dust aerosol optical depths were area-averaged in the
study area 2 (Fig. 6.1). 3d means and seasonal cycles of monthly means of
w METAR , w QuikSCAT , w TMI and AOD dust as well as seasonal cycles of monthly
mean differences w QuikSCAT− w METAR of years 2001 to 2008 were determined. The
relative errors of satellite derived wind speeds were determined using the relation Δw = ((w sat,uncorr− w sat,corr )/w sat,corr )*100 % where w sat,uncorr was the uncorrected
satellite derived wind speed and w sat,corr was the corrected ones (sat = QuikSCAT,
TMI). The corrected satellite derived wind speed w sat,corr was given by w sat,corr =
w sat,uncorr −U*AOD dust. The term U was the slope of the linear fit of seasonal cycles
of monthly mean differences. A detailed description of the methods was given in
Ohde 2010.
4 From http://data.eol.ucar.edu.
5 From http://rapidfire.sci.gsfc.nasa.gov.
125
400
400
wavelength (nm)
0
0.01
0.02
0.03
0.04
r (dimensionless)
open sea
coast
wavelength (nm)
0
0.2
0.4
0.6
k
d (m -1
)
open sea
coast
a
b
500
500
600
600
700
700
Fig. 6.2 The total internal reflectance (2a) and the diffuse attenuation coefficient (2b) are shown
for the open sea station and the coastal station (according to Ohde and Siegel 2013)
6.2.3 Methods in Relation to Dust Impact on Satellite Wind speed
The study area 2 in Fig. 6.1 was selected to investigate the influence of Saharan
dust on satellite derived ocean surface wind speeds (details in Ohde 2010). The
area was located close to the airport on the island Sal in order to use ground truth
wind speeds (w METAR ) from the METAR weather station GVAC
4 . The wind speed
products w QuikSCAT and w TMI of QuikSCAT and TMI (TRMM Microwave Imager)
were downloaded from http://www.remss.com. QuikSCAT and TMI measured wind
speeds at a height of 10 m above the ocean surface using frequency of 13.4, and
10.7 and 37 GHz, respectively. Data of aerosol optical depth of MODIS were used
to approximate the optical depth of the dust component (AOD dust ). The data were
downloaded from the Giovanni archive (http://daac.gsfc.nasa.gov). The aerosol dust
components were derived from the aerosol optical depths at 550 nm of MODIS using
the method of Kaufman et al. (2005). Quasi true-colour images of the MODIS sensor
were used to verify Saharan dust storms
5 .
The ground truth wind speeds of the GVAC METAR station were converted
to the same height of 10 m as the satellite derived wind speeds using the atmospheric dispersion relation (Prandtl 1904). The wind speed products of QuikSCAT
and TMI as well as the dust aerosol optical depths were area-averaged in the
study area 2 (Fig. 6.1). 3d means and seasonal cycles of monthly means of
w METAR , w QuikSCAT , w TMI and AOD dust as well as seasonal cycles of monthly
mean differences w QuikSCAT− w METAR of years 2001 to 2008 were determined. The
relative errors of satellite derived wind speeds were determined using the relation Δw = ((w sat,uncorr− w sat,corr )/w sat,corr )*100 % where w sat,uncorr was the uncorrected
satellite derived wind speed and w sat,corr was the corrected ones (sat = QuikSCAT,
TMI). The corrected satellite derived wind speed w sat,corr was given by w sat,corr =
w sat,uncorr −U*AOD dust. The term U was the slope of the linear fit of seasonal cycles
of monthly mean differences. A detailed description of the methods was given in
Ohde 2010.
4 From http://data.eol.ucar.edu.
5 From http://rapidfire.sci.gsfc.nasa.gov.