

5 Mesoscale Dynamics in the Canary Islands Area . . .
111
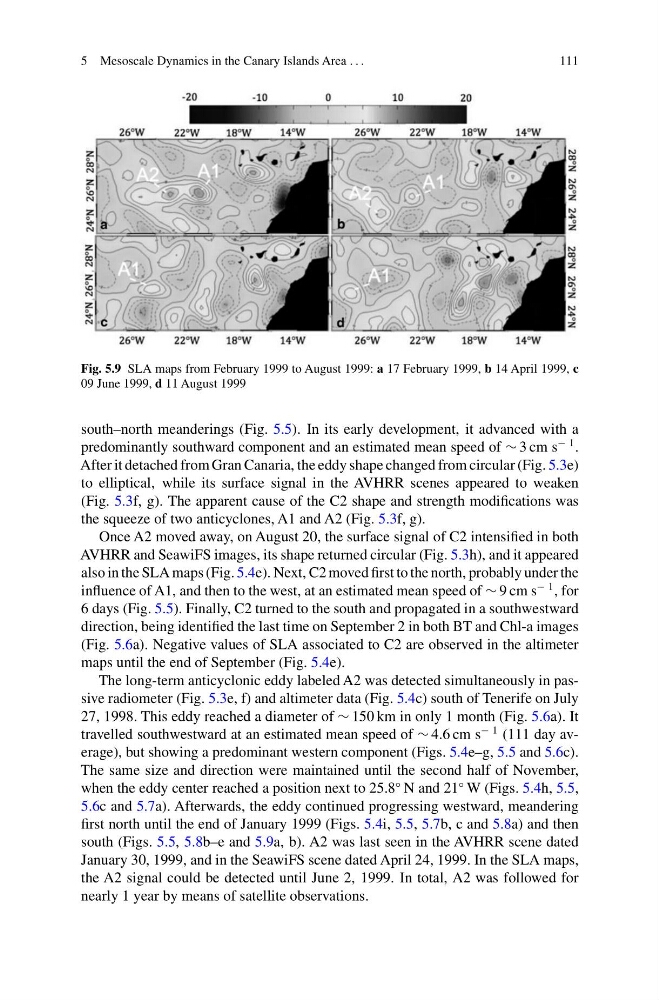
Fig. 5.9 SLA maps from February 1999 to August 1999: a 17 February 1999, b 14 April 1999, c
09 June 1999, d 11 August 1999
south–north meanderings (Fig. 5.5). In its early development, it advanced with a
predominantly southward component and an estimated mean speed of ∼ 3 cm s
− 1 .
After it detached from Gran Canaria, the eddy shape changed from circular (Fig. 5.3e)
to elliptical, while its surface signal in the AVHRR scenes appeared to weaken
(Fig. 5.3f, g). The apparent cause of the C2 shape and strength modifications was
the squeeze of two anticyclones, A1 and A2 (Fig. 5.3f, g).
Once A2 moved away, on August 20, the surface signal of C2 intensified in both
AVHRR and SeawiFS images, its shape returned circular (Fig. 5.3h), and it appeared
also in the SLA maps (Fig. 5.4e). Next, C2 moved first to the north, probably under the
influence of A1, and then to the west, at an estimated mean speed of ∼ 9 cm s
− 1 , for
6 days (Fig. 5.5). Finally, C2 turned to the south and propagated in a southwestward
direction, being identified the last time on September 2 in both BT and Chl-a images
(Fig. 5.6a). Negative values of SLA associated to C2 are observed in the altimeter
maps until the end of September (Fig. 5.4e).
The long-term anticyclonic eddy labeled A2 was detected simultaneously in passive radiometer (Fig. 5.3e, f) and altimeter data (Fig. 5.4c) south of Tenerife on July
27, 1998. This eddy reached a diameter of ∼ 150 km in only 1 month (Fig. 5.6a). It
travelled southwestward at an estimated mean speed of ∼ 4.6 cm s
− 1 (111 day average), but showing a predominant western component (Figs. 5.4e–g, 5.5 and 5.6c).
The same size and direction were maintained until the second half of November,
when the eddy center reached a position next to 25.8
◦ N and 21
◦ W (Figs. 5.4h, 5.5,
5.6c and 5.7a). Afterwards, the eddy continued progressing westward, meandering
first north until the end of January 1999 (Figs. 5.4i, 5.5, 5.7b, c and 5.8a) and then
south (Figs. 5.5, 5.8b–e and 5.9a, b). A2 was last seen in the AVHRR scene dated
January 30, 1999, and in the SeawiFS scene dated April 24, 1999. In the SLA maps,
the A2 signal could be detected until June 2, 1999. In total, A2 was followed for
nearly 1 year by means of satellite observations.
111
Fig. 5.9 SLA maps from February 1999 to August 1999: a 17 February 1999, b 14 April 1999, c
09 June 1999, d 11 August 1999
south–north meanderings (Fig. 5.5). In its early development, it advanced with a
predominantly southward component and an estimated mean speed of ∼ 3 cm s
− 1 .
After it detached from Gran Canaria, the eddy shape changed from circular (Fig. 5.3e)
to elliptical, while its surface signal in the AVHRR scenes appeared to weaken
(Fig. 5.3f, g). The apparent cause of the C2 shape and strength modifications was
the squeeze of two anticyclones, A1 and A2 (Fig. 5.3f, g).
Once A2 moved away, on August 20, the surface signal of C2 intensified in both
AVHRR and SeawiFS images, its shape returned circular (Fig. 5.3h), and it appeared
also in the SLA maps (Fig. 5.4e). Next, C2 moved first to the north, probably under the
influence of A1, and then to the west, at an estimated mean speed of ∼ 9 cm s
− 1 , for
6 days (Fig. 5.5). Finally, C2 turned to the south and propagated in a southwestward
direction, being identified the last time on September 2 in both BT and Chl-a images
(Fig. 5.6a). Negative values of SLA associated to C2 are observed in the altimeter
maps until the end of September (Fig. 5.4e).
The long-term anticyclonic eddy labeled A2 was detected simultaneously in passive radiometer (Fig. 5.3e, f) and altimeter data (Fig. 5.4c) south of Tenerife on July
27, 1998. This eddy reached a diameter of ∼ 150 km in only 1 month (Fig. 5.6a). It
travelled southwestward at an estimated mean speed of ∼ 4.6 cm s
− 1 (111 day average), but showing a predominant western component (Figs. 5.4e–g, 5.5 and 5.6c).
The same size and direction were maintained until the second half of November,
when the eddy center reached a position next to 25.8
◦ N and 21
◦ W (Figs. 5.4h, 5.5,
5.6c and 5.7a). Afterwards, the eddy continued progressing westward, meandering
first north until the end of January 1999 (Figs. 5.4i, 5.5, 5.7b, c and 5.8a) and then
south (Figs. 5.5, 5.8b–e and 5.9a, b). A2 was last seen in the AVHRR scene dated
January 30, 1999, and in the SeawiFS scene dated April 24, 1999. In the SLA maps,
the A2 signal could be detected until June 2, 1999. In total, A2 was followed for
nearly 1 year by means of satellite observations.