

110
L. G.-Weil et al.
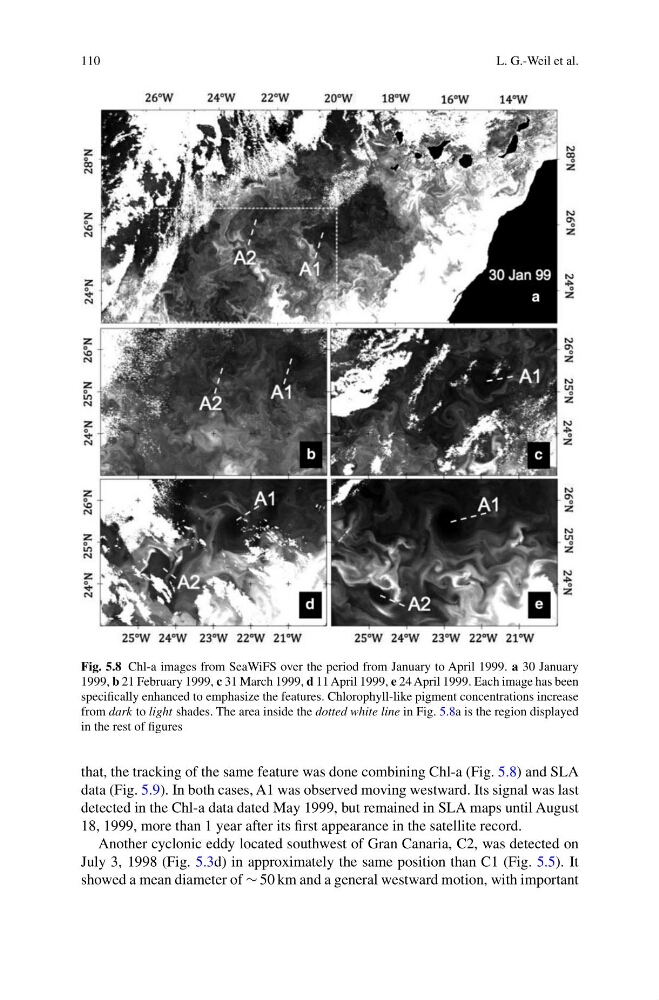
Fig. 5.8 Chl-a images from SeaWiFS over the period from January to April 1999. a 30 January
1999, b 21 February 1999, c 31 March 1999, d 11 April 1999, e 24 April 1999. Each image has been
specifically enhanced to emphasize the features. Chlorophyll-like pigment concentrations increase
from dark to light shades. The area inside the dotted white line in Fig. 5.8a is the region displayed
in the rest of figures
that, the tracking of the same feature was done combining Chl-a (Fig. 5.8) and SLA
data (Fig. 5.9). In both cases, A1 was observed moving westward. Its signal was last
detected in the Chl-a data dated May 1999, but remained in SLA maps until August
18, 1999, more than 1 year after its first appearance in the satellite record.
Another cyclonic eddy located southwest of Gran Canaria, C2, was detected on
July 3, 1998 (Fig. 5.3d) in approximately the same position than C1 (Fig. 5.5). It
showed a mean diameter of ∼ 50 km and a general westward motion, with important
L. G.-Weil et al.
Fig. 5.8 Chl-a images from SeaWiFS over the period from January to April 1999. a 30 January
1999, b 21 February 1999, c 31 March 1999, d 11 April 1999, e 24 April 1999. Each image has been
specifically enhanced to emphasize the features. Chlorophyll-like pigment concentrations increase
from dark to light shades. The area inside the dotted white line in Fig. 5.8a is the region displayed
in the rest of figures
that, the tracking of the same feature was done combining Chl-a (Fig. 5.8) and SLA
data (Fig. 5.9). In both cases, A1 was observed moving westward. Its signal was last
detected in the Chl-a data dated May 1999, but remained in SLA maps until August
18, 1999, more than 1 year after its first appearance in the satellite record.
Another cyclonic eddy located southwest of Gran Canaria, C2, was detected on
July 3, 1998 (Fig. 5.3d) in approximately the same position than C1 (Fig. 5.5). It
showed a mean diameter of ∼ 50 km and a general westward motion, with important