

5 Mesoscale Dynamics in the Canary Islands Area . . .
107
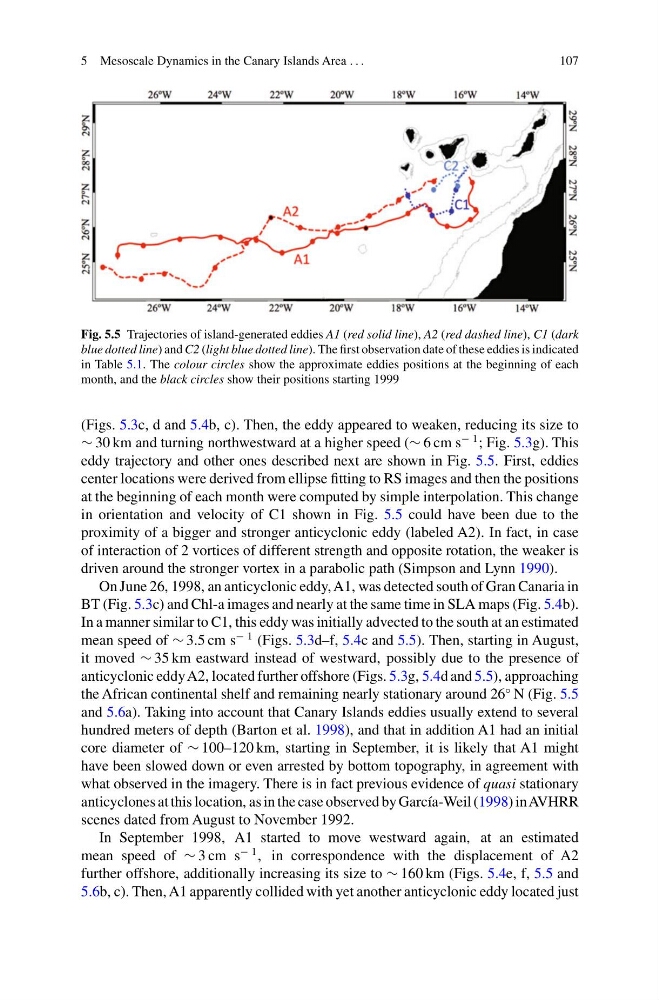
Fig. 5.5 Trajectories of island-generated eddies A1 (red solid line), A2 (red dashed line), C1 (dark
blue dotted line) and C2 (light blue dotted line). The first observation date of these eddies is indicated
in Table 5.1. The colour circles show the approximate eddies positions at the beginning of each
month, and the black circles show their positions starting 1999
(Figs. 5.3c, d and 5.4b, c). Then, the eddy appeared to weaken, reducing its size to
∼ 30 km and turning northwestward at a higher speed (∼ 6 cm s
− 1 ; Fig. 5.3g). This
eddy trajectory and other ones described next are shown in Fig. 5.5. First, eddies
center locations were derived from ellipse fitting to RS images and then the positions
at the beginning of each month were computed by simple interpolation. This change
in orientation and velocity of C1 shown in Fig. 5.5 could have been due to the
proximity of a bigger and stronger anticyclonic eddy (labeled A2). In fact, in case
of interaction of 2 vortices of different strength and opposite rotation, the weaker is
driven around the stronger vortex in a parabolic path (Simpson and Lynn 1990).
On June 26, 1998, an anticyclonic eddy, A1, was detected south of Gran Canaria in
BT (Fig. 5.3c) and Chl-a images and nearly at the same time in SLA maps (Fig. 5.4b).
In a manner similar to C1, this eddy was initially advected to the south at an estimated
mean speed of ∼ 3.5 cm s
− 1 (Figs. 5.3d–f, 5.4c and 5.5). Then, starting in August,
it moved ∼ 35 km eastward instead of westward, possibly due to the presence of
anticyclonic eddy A2, located further offshore (Figs. 5.3g, 5.4d and 5.5), approaching
the African continental shelf and remaining nearly stationary around 26
◦ N (Fig. 5.5
and 5.6a). Taking into account that Canary Islands eddies usually extend to several
hundred meters of depth (Barton et al. 1998), and that in addition A1 had an initial
core diameter of ∼ 100–120 km, starting in September, it is likely that A1 might
have been slowed down or even arrested by bottom topography, in agreement with
what observed in the imagery. There is in fact previous evidence of quasi stationary
anticyclones at this location, as in the case observed by García-Weil (1998) inAVHRR
scenes dated from August to November 1992.
In September 1998, A1 started to move westward again, at an estimated
mean speed of ∼ 3 cm s
− 1 , in correspondence with the displacement of A2
further offshore, additionally increasing its size to ∼ 160 km (Figs. 5.4e, f, 5.5 and
5.6b, c). Then, A1 apparently collided with yet another anticyclonic eddy located just
107
Fig. 5.5 Trajectories of island-generated eddies A1 (red solid line), A2 (red dashed line), C1 (dark
blue dotted line) and C2 (light blue dotted line). The first observation date of these eddies is indicated
in Table 5.1. The colour circles show the approximate eddies positions at the beginning of each
month, and the black circles show their positions starting 1999
(Figs. 5.3c, d and 5.4b, c). Then, the eddy appeared to weaken, reducing its size to
∼ 30 km and turning northwestward at a higher speed (∼ 6 cm s
− 1 ; Fig. 5.3g). This
eddy trajectory and other ones described next are shown in Fig. 5.5. First, eddies
center locations were derived from ellipse fitting to RS images and then the positions
at the beginning of each month were computed by simple interpolation. This change
in orientation and velocity of C1 shown in Fig. 5.5 could have been due to the
proximity of a bigger and stronger anticyclonic eddy (labeled A2). In fact, in case
of interaction of 2 vortices of different strength and opposite rotation, the weaker is
driven around the stronger vortex in a parabolic path (Simpson and Lynn 1990).
On June 26, 1998, an anticyclonic eddy, A1, was detected south of Gran Canaria in
BT (Fig. 5.3c) and Chl-a images and nearly at the same time in SLA maps (Fig. 5.4b).
In a manner similar to C1, this eddy was initially advected to the south at an estimated
mean speed of ∼ 3.5 cm s
− 1 (Figs. 5.3d–f, 5.4c and 5.5). Then, starting in August,
it moved ∼ 35 km eastward instead of westward, possibly due to the presence of
anticyclonic eddy A2, located further offshore (Figs. 5.3g, 5.4d and 5.5), approaching
the African continental shelf and remaining nearly stationary around 26
◦ N (Fig. 5.5
and 5.6a). Taking into account that Canary Islands eddies usually extend to several
hundred meters of depth (Barton et al. 1998), and that in addition A1 had an initial
core diameter of ∼ 100–120 km, starting in September, it is likely that A1 might
have been slowed down or even arrested by bottom topography, in agreement with
what observed in the imagery. There is in fact previous evidence of quasi stationary
anticyclones at this location, as in the case observed by García-Weil (1998) inAVHRR
scenes dated from August to November 1992.
In September 1998, A1 started to move westward again, at an estimated
mean speed of ∼ 3 cm s
− 1 , in correspondence with the displacement of A2
further offshore, additionally increasing its size to ∼ 160 km (Figs. 5.4e, f, 5.5 and
5.6b, c). Then, A1 apparently collided with yet another anticyclonic eddy located just