

106
L. G.-Weil et al.
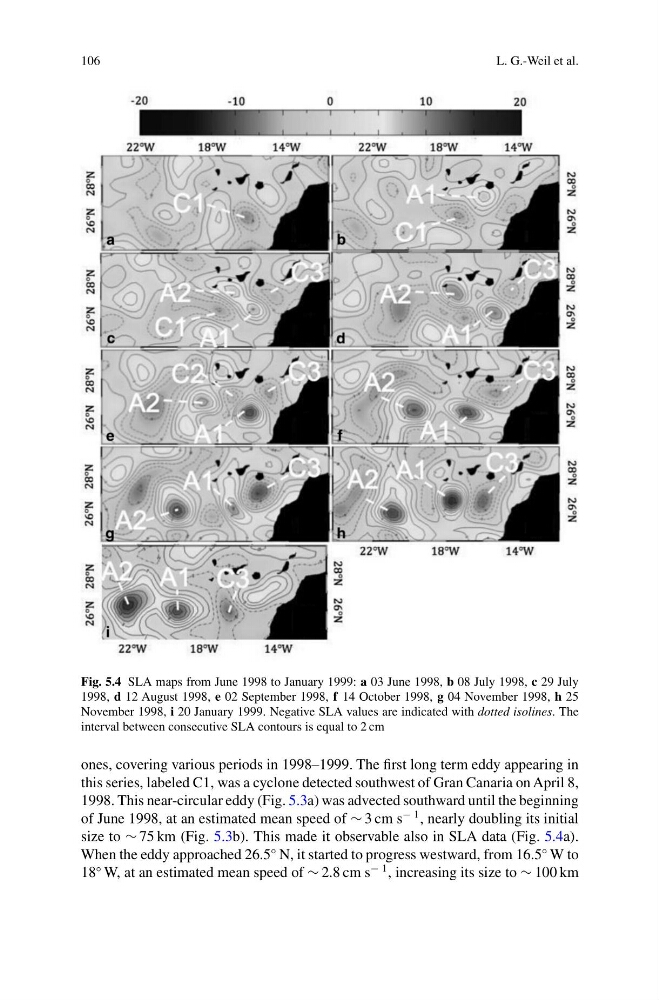
Fig. 5.4 SLA maps from June 1998 to January 1999: a 03 June 1998, b 08 July 1998, c 29 July
1998, d 12 August 1998, e 02 September 1998, f 14 October 1998, g 04 November 1998, h 25
November 1998, i 20 January 1999. Negative SLA values are indicated with dotted isolines. The
interval between consecutive SLA contours is equal to 2 cm
ones, covering various periods in 1998–1999. The first long term eddy appearing in
this series, labeled C1, was a cyclone detected southwest of Gran Canaria on April 8,
1998. This near-circular eddy (Fig. 5.3a) was advected southward until the beginning
of June 1998, at an estimated mean speed of ∼ 3 cm s
− 1 , nearly doubling its initial
size to ∼ 75 km (Fig. 5.3b). This made it observable also in SLA data (Fig. 5.4a).
When the eddy approached 26.5
◦ N, it started to progress westward, from 16.5
◦ W to
18
◦ W, at an estimated mean speed of ∼ 2.8 cm s
− 1 , increasing its size to ∼ 100 km
L. G.-Weil et al.
Fig. 5.4 SLA maps from June 1998 to January 1999: a 03 June 1998, b 08 July 1998, c 29 July
1998, d 12 August 1998, e 02 September 1998, f 14 October 1998, g 04 November 1998, h 25
November 1998, i 20 January 1999. Negative SLA values are indicated with dotted isolines. The
interval between consecutive SLA contours is equal to 2 cm
ones, covering various periods in 1998–1999. The first long term eddy appearing in
this series, labeled C1, was a cyclone detected southwest of Gran Canaria on April 8,
1998. This near-circular eddy (Fig. 5.3a) was advected southward until the beginning
of June 1998, at an estimated mean speed of ∼ 3 cm s
− 1 , nearly doubling its initial
size to ∼ 75 km (Fig. 5.3b). This made it observable also in SLA data (Fig. 5.4a).
When the eddy approached 26.5
◦ N, it started to progress westward, from 16.5
◦ W to
18
◦ W, at an estimated mean speed of ∼ 2.8 cm s
− 1 , increasing its size to ∼ 100 km