

5 Mesoscale Dynamics in the Canary Islands Area . . .
103
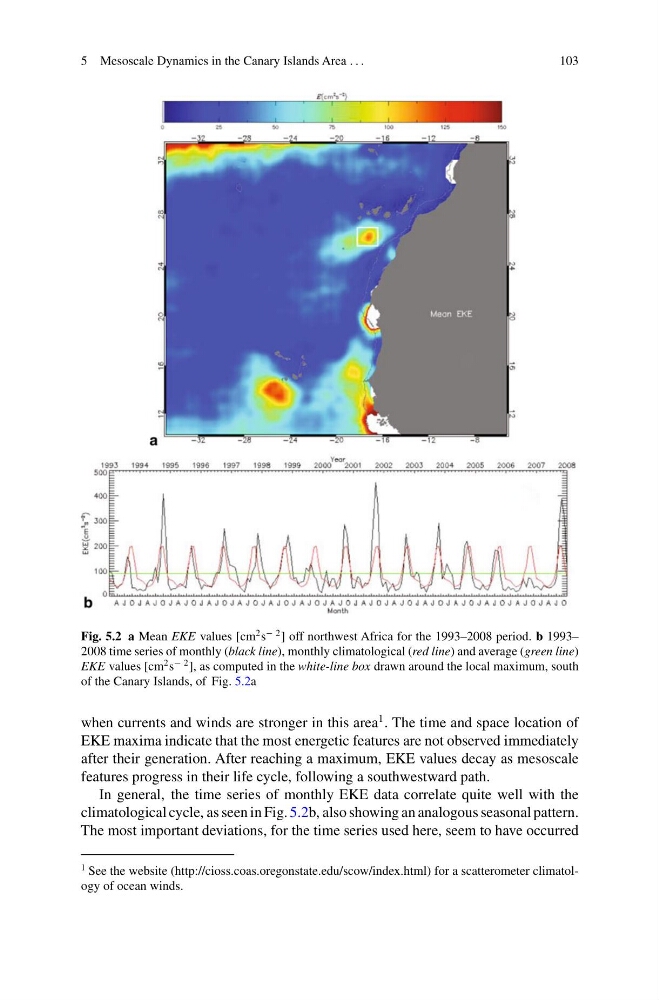
Fig. 5.2 a Mean EKE values [cm
2 s
− 2 ] off northwest Africa for the 1993–2008 period. b 1993–
2008 time series of monthly (black line), monthly climatological (red line) and average (green line)
EKE values [cm
2 s
− 2 ], as computed in the white-line box drawn around the local maximum, south
of the Canary Islands, of Fig. 5.2a
when currents and winds are stronger in this area
1 . The time and space location of
EKE maxima indicate that the most energetic features are not observed immediately
after their generation. After reaching a maximum, EKE values decay as mesoscale
features progress in their life cycle, following a southwestward path.
In general, the time series of monthly EKE data correlate quite well with the
climatological cycle, as seen in Fig. 5.2b, also showing an analogous seasonal pattern.
The most important deviations, for the time series used here, seem to have occurred
1 See the website (http://cioss.coas.oregonstate.edu/scow/index.html) for a scatterometer climatology of ocean winds.
103
Fig. 5.2 a Mean EKE values [cm
2 s
− 2 ] off northwest Africa for the 1993–2008 period. b 1993–
2008 time series of monthly (black line), monthly climatological (red line) and average (green line)
EKE values [cm
2 s
− 2 ], as computed in the white-line box drawn around the local maximum, south
of the Canary Islands, of Fig. 5.2a
when currents and winds are stronger in this area
1 . The time and space location of
EKE maxima indicate that the most energetic features are not observed immediately
after their generation. After reaching a maximum, EKE values decay as mesoscale
features progress in their life cycle, following a southwestward path.
In general, the time series of monthly EKE data correlate quite well with the
climatological cycle, as seen in Fig. 5.2b, also showing an analogous seasonal pattern.
The most important deviations, for the time series used here, seem to have occurred
1 See the website (http://cioss.coas.oregonstate.edu/scow/index.html) for a scatterometer climatology of ocean winds.