

Conveyor
Queue
OVen
68
4. Epidemics in the Marine System
LEAKAGE FRACTION = MORTALITY_RATE
NO-LEAK ZONE = 2.4
RECOVERY = CONVEYOR OUTFLOW
SUSCEPTIBLE(t) = SUSCEPTIBLE(t-dt) + (LOSS_OF_IMMUNITY
+ NET_BIRTHS-INFECTION) * dt
INIT SUSCEPTIBLE = 1990
INFLOWS:
LOSS_OF_IMMUNITY = CONVEYOR OUTFLOW
NET_BIRTHS = NET_BIRTH_RATE* (IMMUNE+SUSCEPTIBLE) * (1 -
(IMMUNE+INFECTED+SUSCEPTIBLE) /4000)
OUTFLOWS:
INFECTION = CONTACT_RATE*SUSCEPTIBLE*INFECTED
CONTACT_RATE = .0005
MORTALITY_RATE = .1
NET_BIRTH_RATE = . 02
TOTAL_POPULATION = IMMUNE + INFECTED + SUSCEPTIBLE
4.3. Creating Submodels
The model of the previous section consists, in essence, of three sets of calculations: determination of net births due to nondisease-related processes,
calculation of the spread of the disease , and determination of diseaserelated deaths. Let us separate these three sets of calculations , and in the
process learn another feature of STELLA-the submodel feature.
In STELLA, a submodel can be represented by a separate icon and can
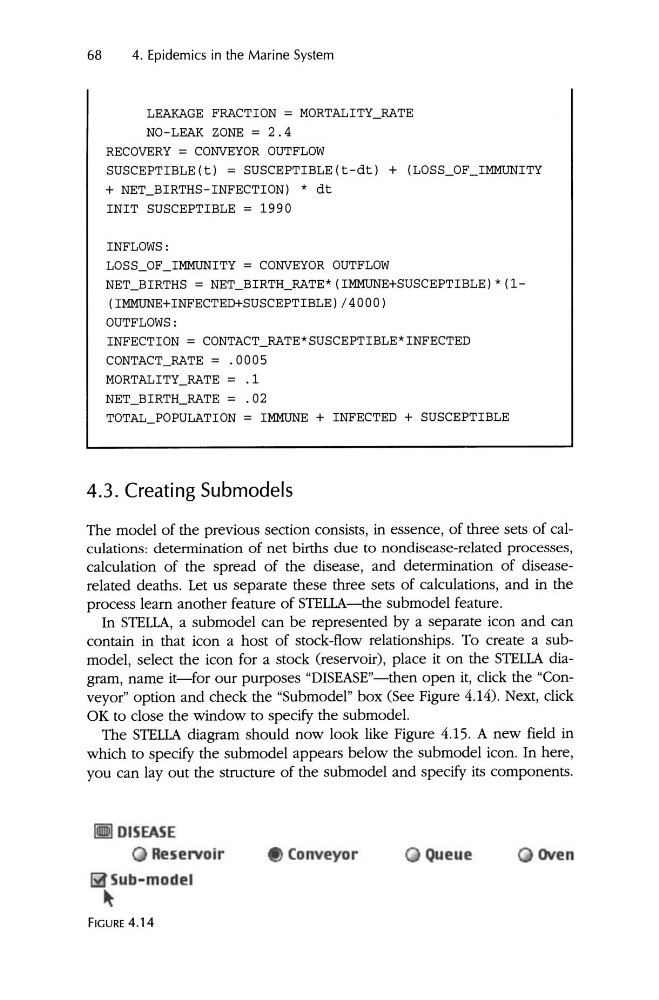
contain in that icon a host of stock-flow relationships. To create a submodel , select the icon for a stock (reservoir) , place it on the STELLA diagram , name it-for our purposes "DISEASE"- then open it, click the "Conveyor" option and check the "Subrnodel" box (See Figure 4.14). Next, click
OK to close the window to specify the submodel.
The STELLA diagram should now look like Figure 4.15. A new field in
which to specify the submodel appears below the submodel icon. In here,
you can layout the structure of the submodel and specify its components.
DISEASE
Reservoir
Sub-model
FIGURE 4.14
Queue
OVen
68
4. Epidemics in the Marine System
LEAKAGE FRACTION = MORTALITY_RATE
NO-LEAK ZONE = 2.4
RECOVERY = CONVEYOR OUTFLOW
SUSCEPTIBLE(t) = SUSCEPTIBLE(t-dt) + (LOSS_OF_IMMUNITY
+ NET_BIRTHS-INFECTION) * dt
INIT SUSCEPTIBLE = 1990
INFLOWS:
LOSS_OF_IMMUNITY = CONVEYOR OUTFLOW
NET_BIRTHS = NET_BIRTH_RATE* (IMMUNE+SUSCEPTIBLE) * (1 -
(IMMUNE+INFECTED+SUSCEPTIBLE) /4000)
OUTFLOWS:
INFECTION = CONTACT_RATE*SUSCEPTIBLE*INFECTED
CONTACT_RATE = .0005
MORTALITY_RATE = .1
NET_BIRTH_RATE = . 02
TOTAL_POPULATION = IMMUNE + INFECTED + SUSCEPTIBLE
4.3. Creating Submodels
The model of the previous section consists, in essence, of three sets of calculations: determination of net births due to nondisease-related processes,
calculation of the spread of the disease , and determination of diseaserelated deaths. Let us separate these three sets of calculations , and in the
process learn another feature of STELLA-the submodel feature.
In STELLA, a submodel can be represented by a separate icon and can
contain in that icon a host of stock-flow relationships. To create a submodel , select the icon for a stock (reservoir) , place it on the STELLA diagram , name it-for our purposes "DISEASE"- then open it, click the "Conveyor" option and check the "Subrnodel" box (See Figure 4.14). Next, click
OK to close the window to specify the submodel.
The STELLA diagram should now look like Figure 4.15. A new field in
which to specify the submodel appears below the submodel icon. In here,
you can layout the structure of the submodel and specify its components.
DISEASE
Reservoir
Sub-model
FIGURE 4.14