

4.1. Basic Model
57
lIIIIIlnfected
Reservoir
o Sub-model
o
.conveyor
Queue
Oven
FIGURE 4.2
For our model, we assume a contract rate of .0002. We also assume that
the disease-induced mortality rate is 10%. Model the number of deaths from
the INFECTED as an outflow called DEATHS and connect the converter for
MORTALITY RATE to that outflow . Then open the DEATHS flow. In the dialog box , you are asked to specify a leakage fraction. The leakage fraction
is the fraction of the inflow into the conveyor that "leaks out " of it. In our
case, the leakage fraction is the MORTALITY RATE. Notice that you can
also specify a no-leak zone . By specifying this no-leak zone as 2, you assume that the disease kills off the INFECTED after 2 periods of their journey
through the conveyor, i.e. after 2 weeks . With a leakage in place , the symbol for the outflow from the conveyor will change.
The complete model of the spread of the disease is shown in Figure 4.4.
Run this model over 400 weeks with a DT =1.
Model results are shown in Figure 4.5. The initially large stocks of susceptible and immune populations results in an initial surge of the epidemic . Consequently, the stock of INFECTED spike s, and with a 3-week
delay the stock of IMMUNE surges and then plateaus for the duration of 30
weeks. The death of 10% of the INFECTED contributes to the long-term reduction of the SUSCEPTIBLE stock and leads to an ever-declining total
population size.
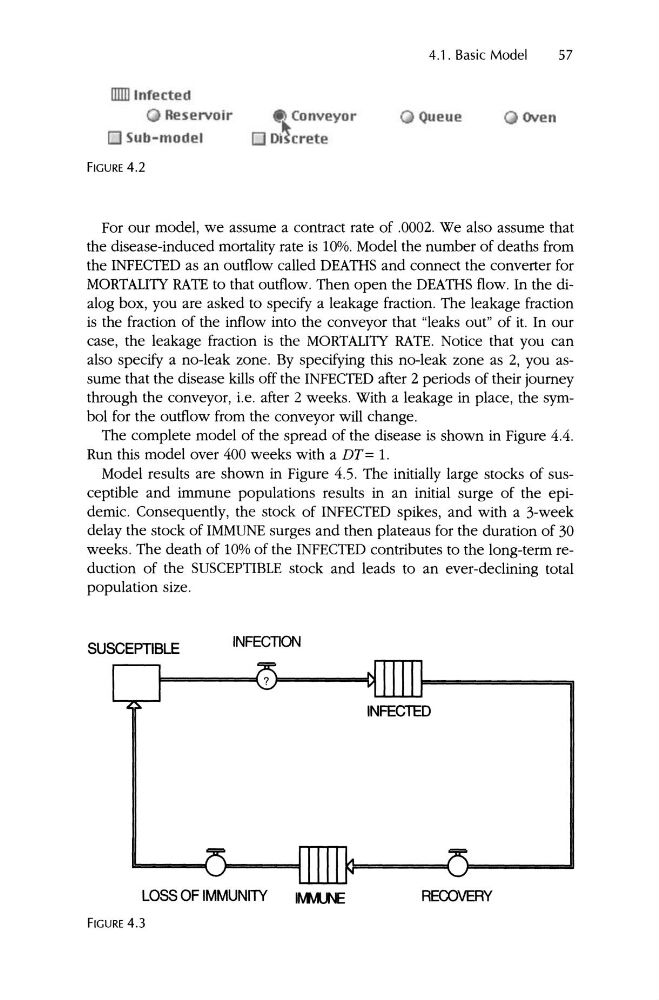
SUSCEPTIBLE
INFECTION
I=======(? )======01
INFEClED
LOSS OFIMMUNITY
FIGURE 4.3
1tvf.U\JE
RECOVERY
57
lIIIIIlnfected
Reservoir
o Sub-model
o
.conveyor
Queue
Oven
FIGURE 4.2
For our model, we assume a contract rate of .0002. We also assume that
the disease-induced mortality rate is 10%. Model the number of deaths from
the INFECTED as an outflow called DEATHS and connect the converter for
MORTALITY RATE to that outflow . Then open the DEATHS flow. In the dialog box , you are asked to specify a leakage fraction. The leakage fraction
is the fraction of the inflow into the conveyor that "leaks out " of it. In our
case, the leakage fraction is the MORTALITY RATE. Notice that you can
also specify a no-leak zone . By specifying this no-leak zone as 2, you assume that the disease kills off the INFECTED after 2 periods of their journey
through the conveyor, i.e. after 2 weeks . With a leakage in place , the symbol for the outflow from the conveyor will change.
The complete model of the spread of the disease is shown in Figure 4.4.
Run this model over 400 weeks with a DT =1.
Model results are shown in Figure 4.5. The initially large stocks of susceptible and immune populations results in an initial surge of the epidemic . Consequently, the stock of INFECTED spike s, and with a 3-week
delay the stock of IMMUNE surges and then plateaus for the duration of 30
weeks. The death of 10% of the INFECTED contributes to the long-term reduction of the SUSCEPTIBLE stock and leads to an ever-declining total
population size.
SUSCEPTIBLE
INFECTION
I=======(? )======01
INFEClED
LOSS OFIMMUNITY
FIGURE 4.3
1tvf.U\JE
RECOVERY