

56
4. Epidemics in the Marine System
SUSCEPTIBLE
INFECTION
I====== INFECTED
Kl======(? )=====:::!J
LOSS OFIMMUNITY
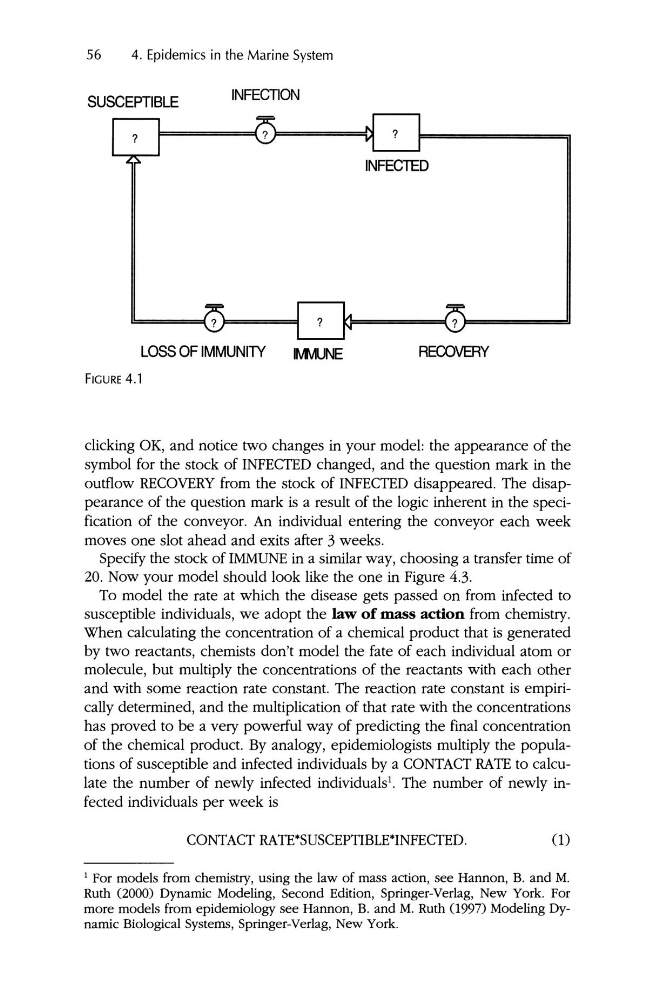
FIGURE 4 .1
Itvfv1UNE
RECOVERY
clicking OK, and notice two changes in your model: the appearance of the
symbol for the stock of INFECTED changed, and the question mark in the
outflow RECOVERY from the stock of INFECTED disappeared. The disappearance of the question mark is a result of the logic inherent in the specification of the conveyor. An individual entering the conveyor each week
moves one slot ahead and exits after 3 weeks.
Specify the stock of IMMUNE in a similar way, choosing a transfer time of
20. Now your model should look like the one in Figure 4.3.
To model the rate at which the disease gets passed on from infected to
susceptible individuals, we adopt the law of mass action from chemistry.
When calculating the concentration of a chemical product that is generated
by two reactants, chemists don't model the fate of each individual atom or
molecule, but multiply the concentrations of the reactants with each other
and with some reaction rate constant. The reaction rate constant is empirically determined, and the multiplication of that rate with the concentrations
has proved to be a very powerful way of predicting the final concentration
of the chemical product. By analogy, epidemiologists multiply the populations of susceptible and infected individuals by a CONTACT RATE to calculate the number of newly infected individuals'. The number of newly infected individuals per week is
CONTACT RATE*SUSCEPTIBLE*INFECTED.
(1)
1 For models from chemistry, using the law of mass action , see Hannon, B. and M.
Ruth (2000) Dynamic Modeling, Second Edition, Springer-Verlag, New York. For
more models from epidemiology see Hannon, B. and M. Ruth (1997) Modeling Dynamic Biological Systems, Springer-Verlag, New York.
4. Epidemics in the Marine System
SUSCEPTIBLE
INFECTION
I====== INFECTED
Kl======(? )=====:::!J
LOSS OFIMMUNITY
FIGURE 4 .1
Itvfv1UNE
RECOVERY
clicking OK, and notice two changes in your model: the appearance of the
symbol for the stock of INFECTED changed, and the question mark in the
outflow RECOVERY from the stock of INFECTED disappeared. The disappearance of the question mark is a result of the logic inherent in the specification of the conveyor. An individual entering the conveyor each week
moves one slot ahead and exits after 3 weeks.
Specify the stock of IMMUNE in a similar way, choosing a transfer time of
20. Now your model should look like the one in Figure 4.3.
To model the rate at which the disease gets passed on from infected to
susceptible individuals, we adopt the law of mass action from chemistry.
When calculating the concentration of a chemical product that is generated
by two reactants, chemists don't model the fate of each individual atom or
molecule, but multiply the concentrations of the reactants with each other
and with some reaction rate constant. The reaction rate constant is empirically determined, and the multiplication of that rate with the concentrations
has proved to be a very powerful way of predicting the final concentration
of the chemical product. By analogy, epidemiologists multiply the populations of susceptible and infected individuals by a CONTACT RATE to calculate the number of newly infected individuals'. The number of newly infected individuals per week is
CONTACT RATE*SUSCEPTIBLE*INFECTED.
(1)
1 For models from chemistry, using the law of mass action , see Hannon, B. and M.
Ruth (2000) Dynamic Modeling, Second Edition, Springer-Verlag, New York. For
more models from epidemiology see Hannon, B. and M. Ruth (1997) Modeling Dynamic Biological Systems, Springer-Verlag, New York.