

46
3. Predator-Prey Dynamics
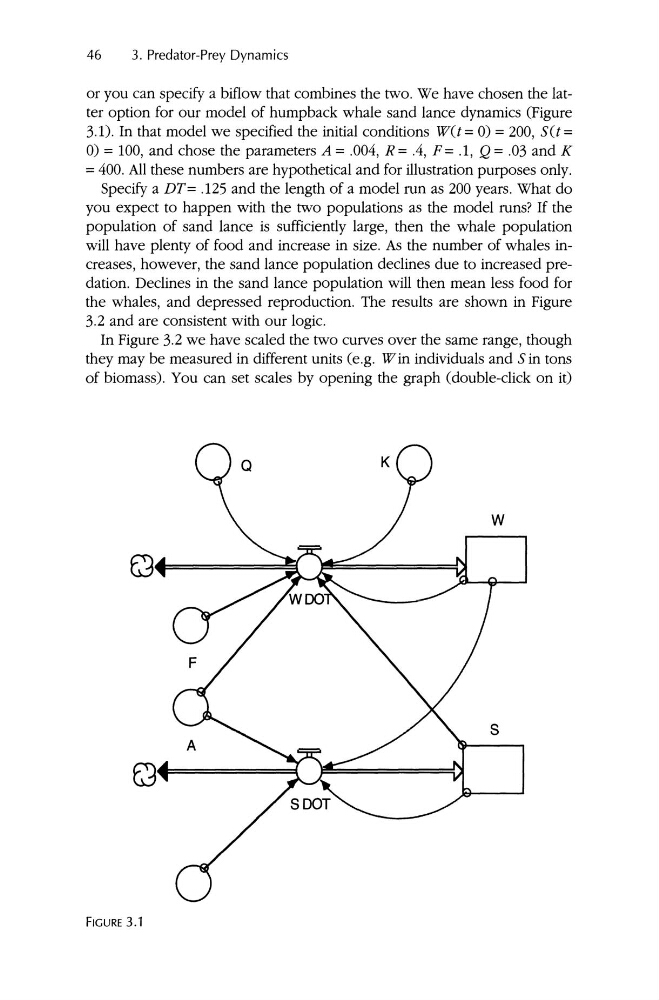
or you can specify a biflow that combines the two. We have chosen the latter option for our model of humpback whale sand lance dynamics (Figure
3.1). In that model we specified the initial conditions wCt= 0) = 200, sCt=
0) = 100, and chose the parameters A = .004, R = .4, F= .1, Q = .03 and K
= 400. All these numbers are hypothetical and for illustration purposes only.
Specify a DT= .125 and the length of a model run as 200 years. What do
you expect to happen with the two populations as the model runs? If the
population of sand lance is sufficiently large, then the whale population
will have plenty of food and increase in size. As the number of whales increases, however, the sand lance population declines due to increased predation . Declines in the sand lance population will then mean less food for
the whales , and depressed reproduction. The results are shown in Figure
3.2 and are consistent with our logic.
In Figure 3.2 we have scaled the two curves over the same range, though
they may be measured in different units (e.g. Win individuals and Sin tons
of biomass). You can set scales by opening the graph (double-click on it)
FIGURE 3.1
3. Predator-Prey Dynamics
or you can specify a biflow that combines the two. We have chosen the latter option for our model of humpback whale sand lance dynamics (Figure
3.1). In that model we specified the initial conditions wCt= 0) = 200, sCt=
0) = 100, and chose the parameters A = .004, R = .4, F= .1, Q = .03 and K
= 400. All these numbers are hypothetical and for illustration purposes only.
Specify a DT= .125 and the length of a model run as 200 years. What do
you expect to happen with the two populations as the model runs? If the
population of sand lance is sufficiently large, then the whale population
will have plenty of food and increase in size. As the number of whales increases, however, the sand lance population declines due to increased predation . Declines in the sand lance population will then mean less food for
the whales , and depressed reproduction. The results are shown in Figure
3.2 and are consistent with our logic.
In Figure 3.2 we have scaled the two curves over the same range, though
they may be measured in different units (e.g. Win individuals and Sin tons
of biomass). You can set scales by opening the graph (double-click on it)
FIGURE 3.1