

414
18. The Global Shrimp Market
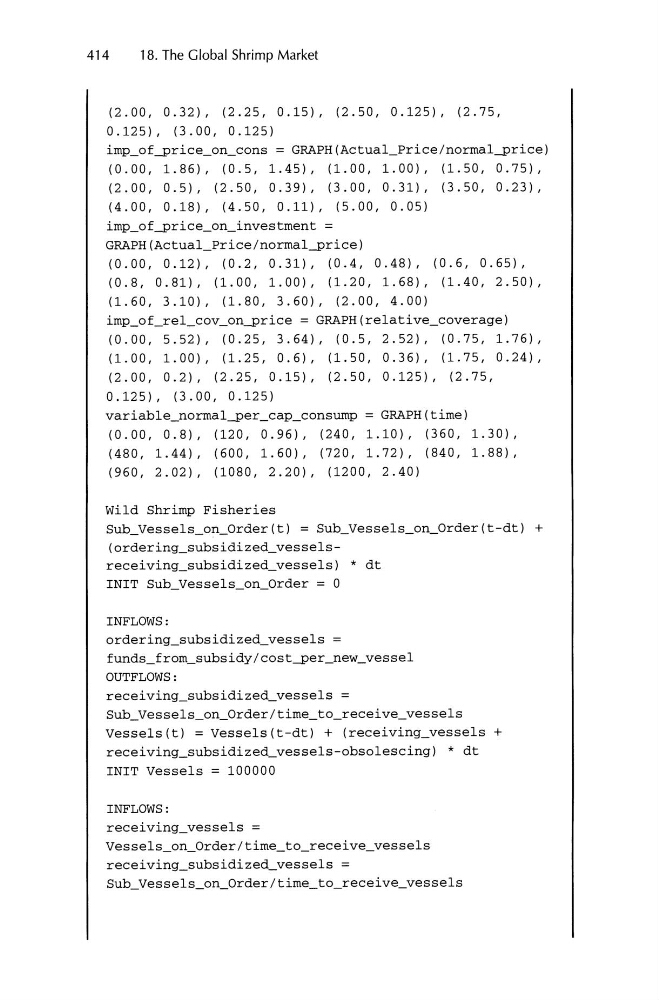
(2.00,0 .32), (2.25,0 .15),
0.125), (3 .00,0 .125)
(2.50 ,0.125), (2.75,
imp_of-price_on_cons = GRAPH(Actual_Price /normal-price)
(0 .00 , 1.86), (0.5, 1.45) , (1.00, 1.00), (1.50, 0 .75),
(2.00 ,
(4.00,
0.5),
0.18),
(2 .50 , 0 .39),
(4.50, 0 .11),
(3.00, 0 .31),
(5.00 , 0 .05)
(3.50, 0.23),
imp_of-price_on_investment =
GRAPH (Actual_Price /normal-price)
(0.00, 0 .12),
(0.8, 0 .81),
(1.60 ,3.10),
(0.2, 0 .31) ,
(1.00, 1.00) ,
(1.80,3 .60),
(0.4, 0 .48),
(1.20, 1.68),
(2 .00,4 .00)
(0 .6 , 0.65),
(1.40, 2.50),
imp_of_rel_cov_on-price = GRAPH(relative_coverage)
(0.00 ,5.52), (0 .25,3 .64) , (0.5,2 .52), (0.75,1.76),
(1.00, 1.00) ,
(2.00,0.2),
(1.25, 0.6),
(2 .25,0.15) ,
0.125), (3 .00,0.125)
(1.50, 0.36),
(2.50,0 .125),
(1. 75, 0.24),
(2.75,
variable_normal-per_cap_consump
GRAPH (time)
(0.00, 0.8),
(480,1.44),
(960,2.02),
(120, 0 .96),
(600 ,1.60),
(1080 , 2 .20),
(240, 1.10) ,
(720,1.72),
(1200,2 .40)
(360, 1.30),
(840,1.88),
Wild Shrimp Fisheries
Sub_Vessels_on_Order(t) = Sub_Vessels_on_Order(t-dt) +
(ordering_subsidized_vesselsreceiving_subsidized_vessels)
INIT Sub_Vessels_on_Order = °
* dt
INFLOWS:
ordering_subsidized_vessels
funds_from_subsidy /cost-per_new_vessel
OUTFLOWS:
receiving_subsidized_vessels =
Sub_Vessels_on_Order /time_to_receive_vessels
Vessels(t) = Vessels (t -dt) + (receiving_vessels +
receiving_subsidized_vessels-obsolescing) * dt
INIT Vessels = 100000
INFLOWS:
receiving_vessels
Vessels_on_Order /time_to_receive_vessels
receiving_subsidized_vessels =
Sub_Vessels_on_Order /time_to_receive_vessels
18. The Global Shrimp Market
(2.00,0 .32), (2.25,0 .15),
0.125), (3 .00,0 .125)
(2.50 ,0.125), (2.75,
imp_of-price_on_cons = GRAPH(Actual_Price /normal-price)
(0 .00 , 1.86), (0.5, 1.45) , (1.00, 1.00), (1.50, 0 .75),
(2.00 ,
(4.00,
0.5),
0.18),
(2 .50 , 0 .39),
(4.50, 0 .11),
(3.00, 0 .31),
(5.00 , 0 .05)
(3.50, 0.23),
imp_of-price_on_investment =
GRAPH (Actual_Price /normal-price)
(0.00, 0 .12),
(0.8, 0 .81),
(1.60 ,3.10),
(0.2, 0 .31) ,
(1.00, 1.00) ,
(1.80,3 .60),
(0.4, 0 .48),
(1.20, 1.68),
(2 .00,4 .00)
(0 .6 , 0.65),
(1.40, 2.50),
imp_of_rel_cov_on-price = GRAPH(relative_coverage)
(0.00 ,5.52), (0 .25,3 .64) , (0.5,2 .52), (0.75,1.76),
(1.00, 1.00) ,
(2.00,0.2),
(1.25, 0.6),
(2 .25,0.15) ,
0.125), (3 .00,0.125)
(1.50, 0.36),
(2.50,0 .125),
(1. 75, 0.24),
(2.75,
variable_normal-per_cap_consump
GRAPH (time)
(0.00, 0.8),
(480,1.44),
(960,2.02),
(120, 0 .96),
(600 ,1.60),
(1080 , 2 .20),
(240, 1.10) ,
(720,1.72),
(1200,2 .40)
(360, 1.30),
(840,1.88),
Wild Shrimp Fisheries
Sub_Vessels_on_Order(t) = Sub_Vessels_on_Order(t-dt) +
(ordering_subsidized_vesselsreceiving_subsidized_vessels)
INIT Sub_Vessels_on_Order = °
* dt
INFLOWS:
ordering_subsidized_vessels
funds_from_subsidy /cost-per_new_vessel
OUTFLOWS:
receiving_subsidized_vessels =
Sub_Vessels_on_Order /time_to_receive_vessels
Vessels(t) = Vessels (t -dt) + (receiving_vessels +
receiving_subsidized_vessels-obsolescing) * dt
INIT Vessels = 100000
INFLOWS:
receiving_vessels
Vessels_on_Order /time_to_receive_vessels
receiving_subsidized_vessels =
Sub_Vessels_on_Order /time_to_receive_vessels