

(IN SECTOR : wild Shrimp Fisheries)
(IN SECTOR: Aquaculture)
413
18.6 . Questions and Tasks
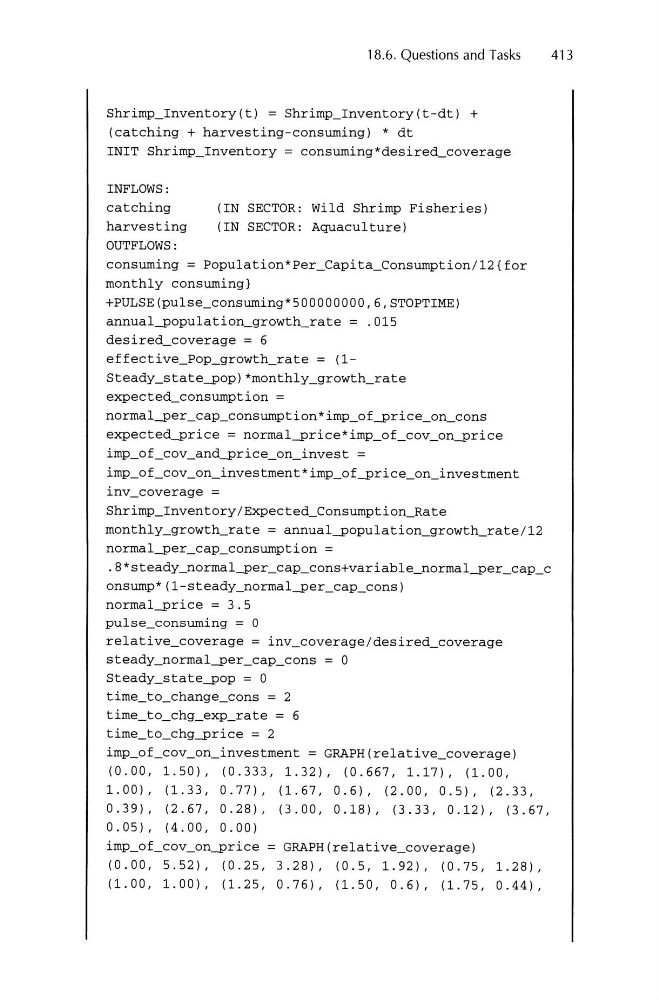
Shrimp_Inventory(t) = Shrimp_Inventory (t-dt) +
(catching + harvesting-consuming) * dt
INIT Shrimp_Inventory = consuming*desired_coverage
INFLOWS :
catching
harvesting
OUTFLOWS :
consuming
Population*Per_Capita_Consumption/12 {for
monthly consuming}
+PULSE(pulse_consuming*500000000,6,STOPTIME)
annual-population_growth_rate = .015
desired_coverage = 6
effective_Pop_growth_rate = (1Steady_state-pop)*monthly_growth_rate
expected_consumption =
norrnal-per_cap_consumption*imp_of-price_on_cons
expected-price = norrnal-price*imp_of_cov_on-price
imp_of_cov_and-price_on_invest =
imp_of_cov_on_investment* imp_of-price_on_investment
inv_coverage =
Shrimp_Inventory /Expected_Consumption_Rate
monthly_growth_rate = annual-population_growth_rate /12
norrnal-per_cap_consumption =
. 8*s t e a dy_nor ma l -pe r _c a p_ c ons +va r i a b l e_nor ma l -pe r_c ap_ c
onsump*(l-steady_normal-per_cap_cons)
normal-price = 3.5
pulse_consuming = 0
relative_coverage = inv_coverage /desired_coverage
steady_normal-per_cap_cons = 0
Steady_state-pop = 0
time_to_change_cons = 2
time_to_chg_exp_rate = 6
time_to_chg-price = 2
imp_of_cov_on_investment = GRAPH(relative_coverage)
(0.00, 1.50), (0.333, 1.32), (0 .667, 1.17), (1.00,
1.00), (1.33,0 .77), (1.67,0.6), (2.00,0 .5), (2.33,
0 .39) , (2 .67,0.28), (3 .00,0.18), (3 .33,0.12), (3 .67,
0 .05), (4.00, 0.00)
imp_of_cov_on-price = GRAPH (relative_coverage)
(0.00 ,5 .52) , (0 .25 ,3 .28), (0.5 ,1.92), (0.75,1.28),
(1.00, 1.00) , (1.25, 0 .76) , (1.50, 0.6), (1. 75, 0 .44),
(IN SECTOR: Aquaculture)
413
18.6 . Questions and Tasks
Shrimp_Inventory(t) = Shrimp_Inventory (t-dt) +
(catching + harvesting-consuming) * dt
INIT Shrimp_Inventory = consuming*desired_coverage
INFLOWS :
catching
harvesting
OUTFLOWS :
consuming
Population*Per_Capita_Consumption/12 {for
monthly consuming}
+PULSE(pulse_consuming*500000000,6,STOPTIME)
annual-population_growth_rate = .015
desired_coverage = 6
effective_Pop_growth_rate = (1Steady_state-pop)*monthly_growth_rate
expected_consumption =
norrnal-per_cap_consumption*imp_of-price_on_cons
expected-price = norrnal-price*imp_of_cov_on-price
imp_of_cov_and-price_on_invest =
imp_of_cov_on_investment* imp_of-price_on_investment
inv_coverage =
Shrimp_Inventory /Expected_Consumption_Rate
monthly_growth_rate = annual-population_growth_rate /12
norrnal-per_cap_consumption =
. 8*s t e a dy_nor ma l -pe r _c a p_ c ons +va r i a b l e_nor ma l -pe r_c ap_ c
onsump*(l-steady_normal-per_cap_cons)
normal-price = 3.5
pulse_consuming = 0
relative_coverage = inv_coverage /desired_coverage
steady_normal-per_cap_cons = 0
Steady_state-pop = 0
time_to_change_cons = 2
time_to_chg_exp_rate = 6
time_to_chg-price = 2
imp_of_cov_on_investment = GRAPH(relative_coverage)
(0.00, 1.50), (0.333, 1.32), (0 .667, 1.17), (1.00,
1.00), (1.33,0 .77), (1.67,0.6), (2.00,0 .5), (2.33,
0 .39) , (2 .67,0.28), (3 .00,0.18), (3 .33,0.12), (3 .67,
0 .05), (4.00, 0.00)
imp_of_cov_on-price = GRAPH (relative_coverage)
(0.00 ,5 .52) , (0 .25 ,3 .28), (0.5 ,1.92), (0.75,1.28),
(1.00, 1.00) , (1.25, 0 .76) , (1.50, 0.6), (1. 75, 0 .44),