

398
18. The Global Shrimp Market
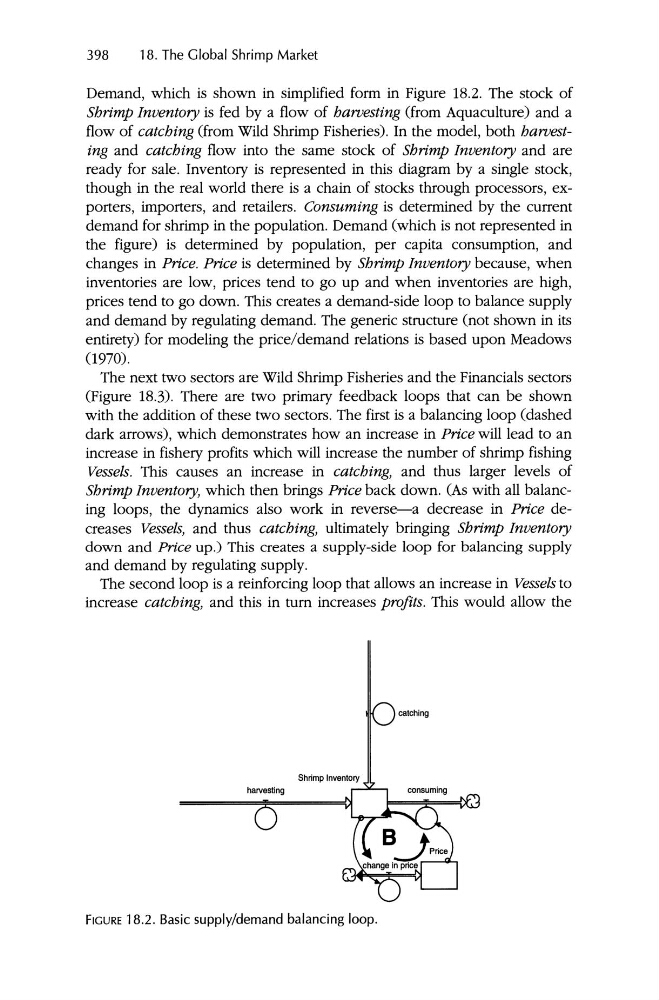
Demand, which is shown in simplified form in Figure 18.2. The stock of
Shrimp Inventory is fed by a flow of harvesting (from Aquaculture) and a
flow of catching (from Wild Shrimp Fisheries). In the model, both harvesting and catching flow into the same stock of Shrimp Inventory and are
ready for sale. Inventory is represented in this diagram by a single stock,
though in the real world there is a chain of stocks through processors, exporters, importers, and retailers. Consuming is determined by the current
demand for shrimp in the population. Demand (which is not represented in
the figure) is determined by population, per capita consumption, and
changes in Price. Price is determined by Shrimp Inventory because, when
inventories are low, prices tend to go up and when inventories are high,
prices tend to go down . This creates a demand-side loop to balance supply
and demand by regulating demand. The generic structure (not shown in its
entirety) for modeling the price/demand relations is based upon Meadows
(970).
The next two sectors are Wild Shrimp Fisheries and the Financials sectors
(Figure 18.3). There are two primary feedback loops that can be shown
with the addition of these two sectors. The first is a balancing loop (dashed
dark arrows), which demonstrates how an increase in Price will lead to an
increase in fishery profits which will increase the number of shrimp fishing
Vessels. This causes an increase in catching, and thus larger levels of
Shrimp Inventory, which then brings Price back down. (As with all balancing loops, the dynamics also work in reverse-a decrease in Price decreases Vessels, and thus catching, ultimately bringing Shrimp Inventory
down and Price up .) This creates a supply-side loop for balancing supply
and demand by regulating supply.
The second loop is a reinforcing loop that allows an increase in Vessels to
increase catching, and this in turn increases profits . This would allow the
FIGURE 18.2. Basic supply/demand balancing loop.
18. The Global Shrimp Market
Demand, which is shown in simplified form in Figure 18.2. The stock of
Shrimp Inventory is fed by a flow of harvesting (from Aquaculture) and a
flow of catching (from Wild Shrimp Fisheries). In the model, both harvesting and catching flow into the same stock of Shrimp Inventory and are
ready for sale. Inventory is represented in this diagram by a single stock,
though in the real world there is a chain of stocks through processors, exporters, importers, and retailers. Consuming is determined by the current
demand for shrimp in the population. Demand (which is not represented in
the figure) is determined by population, per capita consumption, and
changes in Price. Price is determined by Shrimp Inventory because, when
inventories are low, prices tend to go up and when inventories are high,
prices tend to go down . This creates a demand-side loop to balance supply
and demand by regulating demand. The generic structure (not shown in its
entirety) for modeling the price/demand relations is based upon Meadows
(970).
The next two sectors are Wild Shrimp Fisheries and the Financials sectors
(Figure 18.3). There are two primary feedback loops that can be shown
with the addition of these two sectors. The first is a balancing loop (dashed
dark arrows), which demonstrates how an increase in Price will lead to an
increase in fishery profits which will increase the number of shrimp fishing
Vessels. This causes an increase in catching, and thus larger levels of
Shrimp Inventory, which then brings Price back down. (As with all balancing loops, the dynamics also work in reverse-a decrease in Price decreases Vessels, and thus catching, ultimately bringing Shrimp Inventory
down and Price up .) This creates a supply-side loop for balancing supply
and demand by regulating supply.
The second loop is a reinforcing loop that allows an increase in Vessels to
increase catching, and this in turn increases profits . This would allow the
FIGURE 18.2. Basic supply/demand balancing loop.