

346
15. Fish Population Responses to Sea Floor Habitat Alteration
I
1
II
Preydensity
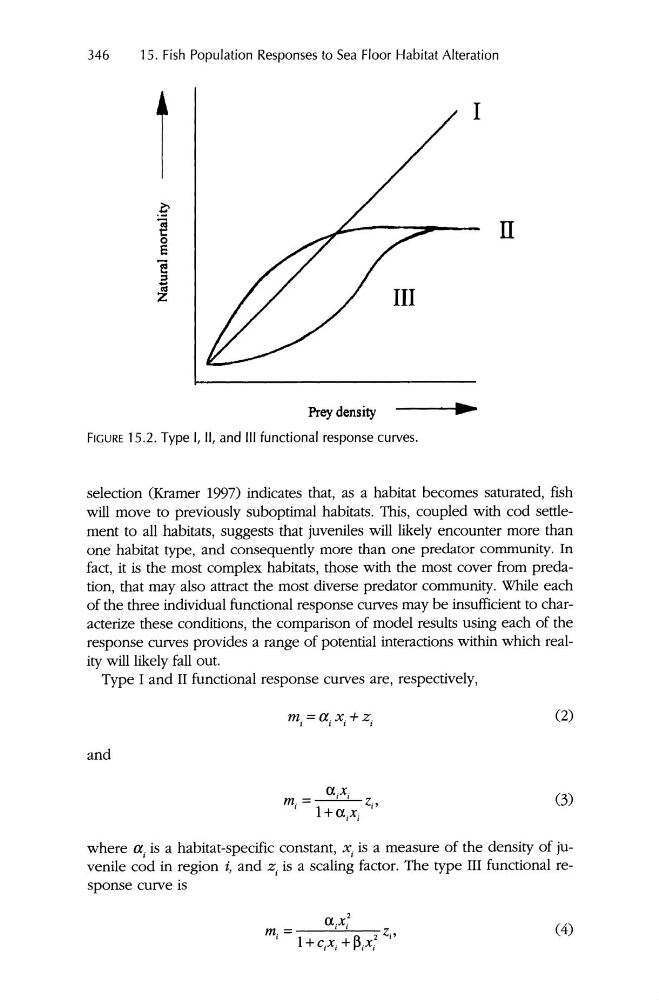
FIGURE 15.2. Type I, II, and III functional response curves.
selection (Kramer 1997) indicates that, as a habitat becomes saturated, fish
will move to previously suboptimal habitats. This, coupled with cod settlement to all habitats, suggests that juveniles will likely encounter more than
one habitat type, and consequently more than one predator community. In
fact, it is the most complex habitats, those with the most cover from predation, that may also attract the most diverse predator community. While each
of the three individual functional response curves may be insufficient to characterize these conditions, the comparison of model results using each of the
response curves provides a range of potential interactions within which reality will likely fall out.
Type I and II functional response curves are , respectively,
(2)
and
(3)
where a i is a habitat-specific constant, X i is a measure of the density of juvenile cod in region i, and Zi is a scaling factor. The type III functional response curve is
ax
2
m. =
I
I
2 Z.,
(4)
I
1+ C,X , +
'
15. Fish Population Responses to Sea Floor Habitat Alteration
I
1
II
Preydensity
FIGURE 15.2. Type I, II, and III functional response curves.
selection (Kramer 1997) indicates that, as a habitat becomes saturated, fish
will move to previously suboptimal habitats. This, coupled with cod settlement to all habitats, suggests that juveniles will likely encounter more than
one habitat type, and consequently more than one predator community. In
fact, it is the most complex habitats, those with the most cover from predation, that may also attract the most diverse predator community. While each
of the three individual functional response curves may be insufficient to characterize these conditions, the comparison of model results using each of the
response curves provides a range of potential interactions within which reality will likely fall out.
Type I and II functional response curves are , respectively,
(2)
and
(3)
where a i is a habitat-specific constant, X i is a measure of the density of juvenile cod in region i, and Zi is a scaling factor. The type III functional response curve is
ax
2
m. =
I
I
2 Z.,
(4)
I
1+ C,X , +
'