

316
14. Dynamics of Multiple Fish Species
species by directing fishing effort to areas with higher population densities.
As a result, fishing-induced mortality rates may be higher in areas of high
population densities.
k
iO
population i and region k is N : (with j = °
The size of the population (in thousands of individuals) of cohort j in
as the cohort of egg, and j = 1,
2, . . . ,Was the cohorts for 1, 2, . . . lu-year-old fish). Egg production and
survival in a given year is given by
k
10
d N iO _
Ak
'b
-;jt-.L..l-' ijNij i j - mio ( d )
1 - jN -
( 1 - d) k
jN iO'
j =l
(1)
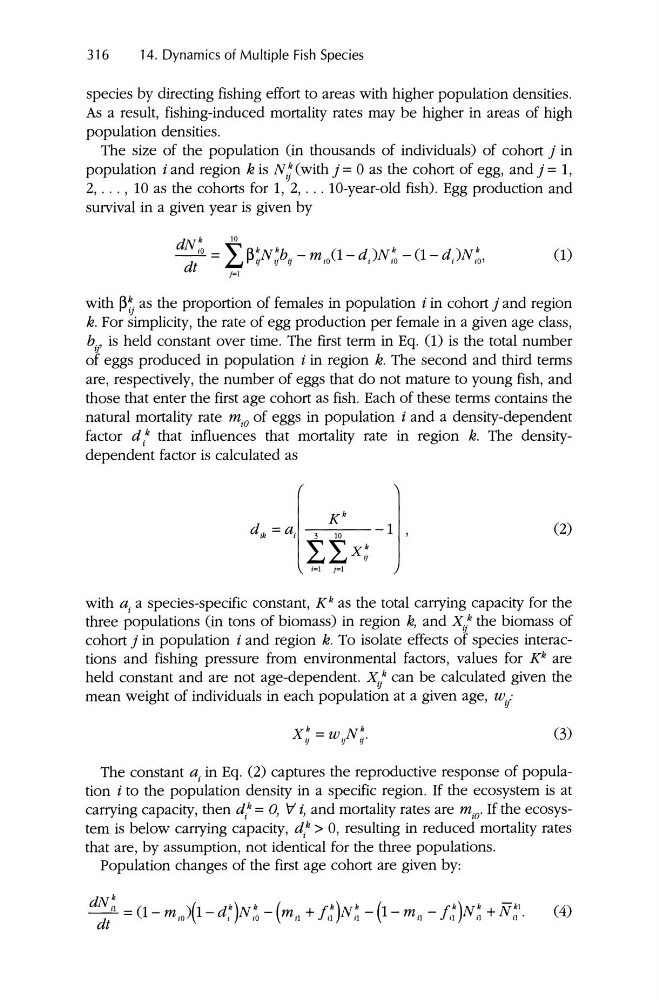
with Pt as the proportion of females in population i in cohort j and region
k. For simplicity, the rate of egg production per female in a given age class,
b , is held constant over time. The first term in Eq. (1) is the total number
lJ
of eggs produced in population i in region k. The second and third terms
are, respectively, the number of eggs that do not mature to young fish, and
those that enter the first age cohort as fish. Each of these terms contains the
natural mortality rate m iO of eggs in population i and a density-dependent
factor d i
k that influences that mortality rate in region k. The densitydependent factor is calculated as
(2)
with a, a species-specific constant, K k as the total carrying capacity for the
three populations (in tons of biomass) in region k, and X/ the biomass of
i
cohort j in population i and region k . To isolate effects of species interactions and fishing pressure from environm ental factors, values for K
k are
held constant and are not age-dependent. X / can be calculated given the
i
mean weight of individuals in each population at a given age, wi i
The constant a i in Eq, (2) captures the reproductive response of population i to the population density in a specific region . If the ecosystem is at
carrying capacity, then d/ = 0, \f i, and mortality rates are m iO' If the ecosystem is below carrying capacity, d/ > 0, resulting in reduced mortality rates
that are, by assumption, not identical for the three populations.
Population changes of the first age cohort are given by:
14. Dynamics of Multiple Fish Species
species by directing fishing effort to areas with higher population densities.
As a result, fishing-induced mortality rates may be higher in areas of high
population densities.
k
iO
population i and region k is N : (with j = °
The size of the population (in thousands of individuals) of cohort j in
as the cohort of egg, and j = 1,
2, . . . ,Was the cohorts for 1, 2, . . . lu-year-old fish). Egg production and
survival in a given year is given by
k
10
d N iO _
Ak
'b
-;jt-.L..l-' ijNij i j - mio ( d )
1 - jN -
( 1 - d) k
jN iO'
j =l
(1)
with Pt as the proportion of females in population i in cohort j and region
k. For simplicity, the rate of egg production per female in a given age class,
b , is held constant over time. The first term in Eq. (1) is the total number
lJ
of eggs produced in population i in region k. The second and third terms
are, respectively, the number of eggs that do not mature to young fish, and
those that enter the first age cohort as fish. Each of these terms contains the
natural mortality rate m iO of eggs in population i and a density-dependent
factor d i
k that influences that mortality rate in region k. The densitydependent factor is calculated as
(2)
with a, a species-specific constant, K k as the total carrying capacity for the
three populations (in tons of biomass) in region k, and X/ the biomass of
i
cohort j in population i and region k . To isolate effects of species interactions and fishing pressure from environm ental factors, values for K
k are
held constant and are not age-dependent. X / can be calculated given the
i
mean weight of individuals in each population at a given age, wi i
The constant a i in Eq, (2) captures the reproductive response of population i to the population density in a specific region . If the ecosystem is at
carrying capacity, then d/ = 0, \f i, and mortality rates are m iO' If the ecosystem is below carrying capacity, d/ > 0, resulting in reduced mortality rates
that are, by assumption, not identical for the three populations.
Population changes of the first age cohort are given by: