

268
13. Nile Perch Population Dynamics in Lake Victoria:
known weight-frequency distribution growing for some years. The model
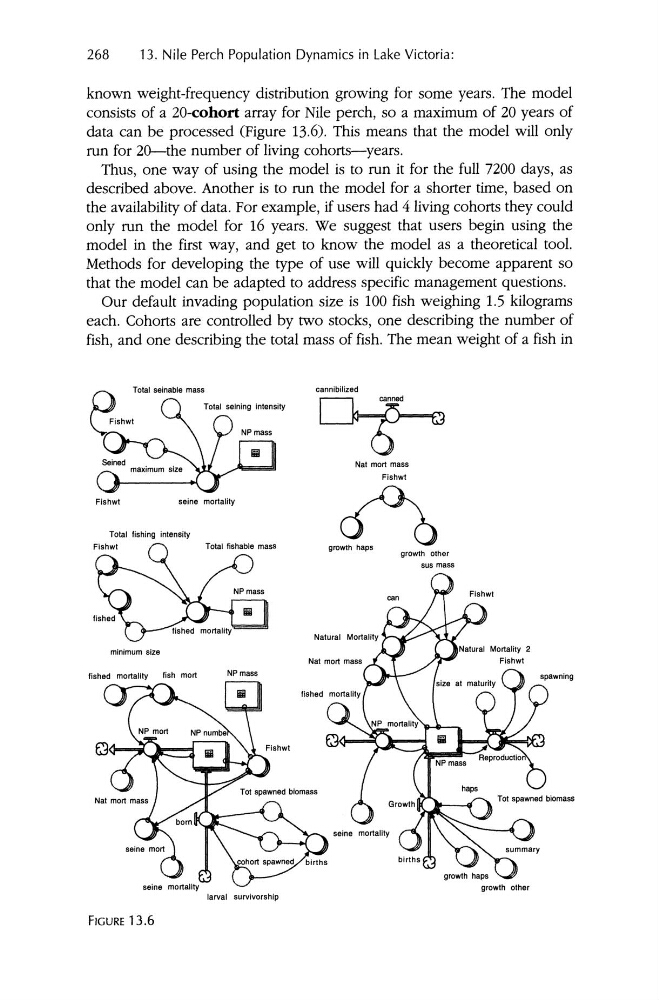
consists of a 20-eohort array for Nile perch , so a maximum of 20 years of
data can be processed (Figure 13.6). This means that the model will only
run for 20-the number of living cohorts--years.
Thus, one way of using the model is to run it for the full 7200 days, as
described above. Another is to run the model for a shorter time, based on
the availability of data. For example, if users had 4 living cohorts they could
only run the model for 16 years. We suggest that users begin using the
model in the first way, and get to know the model as a theoretical tool.
Methods for developing the type of use will quickly become apparent so
that the model can be adapted to address specific management questions .
Our default invading population size is 100 fish weighing 1.5 kilograms
each . Cohorts are controlled by two stocks, one describing the number of
fish, and one describing the total mass of fish. The mean weight of a fish in
cannibillzed
Nat mort mass
Fishwt
Fi shwi
seine mortality
growth other
sus mass
fished mortality
larval survivorship
FIGURE 13.6
13. Nile Perch Population Dynamics in Lake Victoria:
known weight-frequency distribution growing for some years. The model
consists of a 20-eohort array for Nile perch , so a maximum of 20 years of
data can be processed (Figure 13.6). This means that the model will only
run for 20-the number of living cohorts--years.
Thus, one way of using the model is to run it for the full 7200 days, as
described above. Another is to run the model for a shorter time, based on
the availability of data. For example, if users had 4 living cohorts they could
only run the model for 16 years. We suggest that users begin using the
model in the first way, and get to know the model as a theoretical tool.
Methods for developing the type of use will quickly become apparent so
that the model can be adapted to address specific management questions .
Our default invading population size is 100 fish weighing 1.5 kilograms
each . Cohorts are controlled by two stocks, one describing the number of
fish, and one describing the total mass of fish. The mean weight of a fish in
cannibillzed
Nat mort mass
Fishwt
Fi shwi
seine mortality
growth other
sus mass
fished mortality
larval survivorship
FIGURE 13.6