

242
12. Kelp, Urchin s, and Otters in the Californi a Coastal Region
1: Total Kelp Biomass
2: Standing Kelp Biomass
3: Drift Kelp Biomass
6000000.50
<::.-- - - +_- - - - - +-- - - - - 1
3, - - - + - - -3:----1
3
30.00
Months
15.00
45.00
60.00
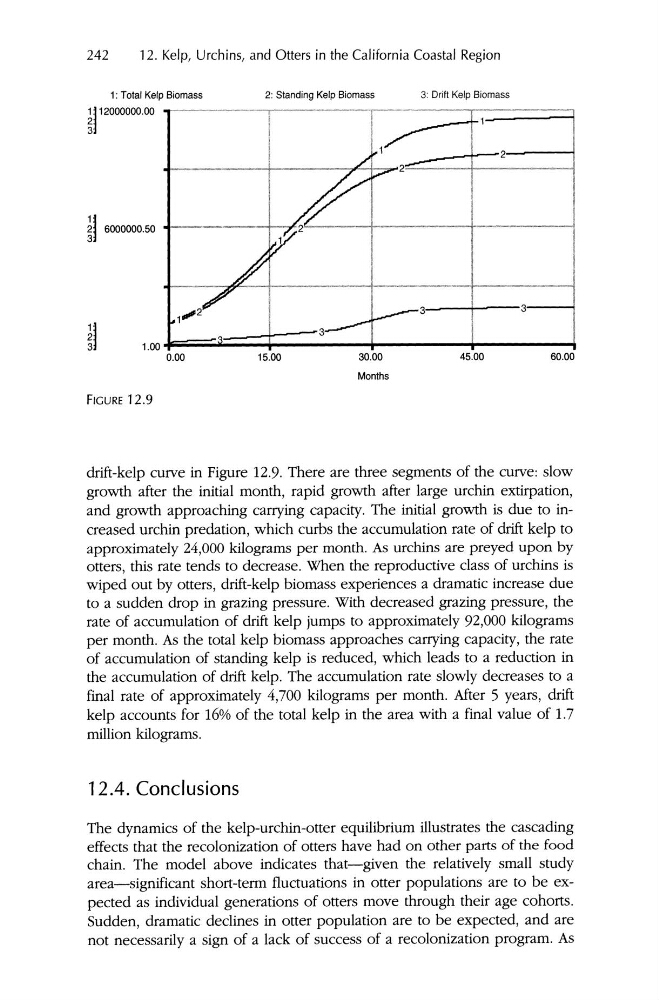
FIGURE 12.9
drift-kelp curve in Figure 12.9. There are three segments of the curve: slow
growth after the initial month , rapid growth after large urchin extirpation,
and growth approaching canying capacity. The initial growth is due to increased urchin predation , which curbs the accumulation rate of drift kelp to
approximately 24,000 kilograms per month . As urchins are preyed upon by
otters, this rate tends to decrease. When the reproductive class of urchins is
wiped out by otters, drift-kelp biomass experiences a dramatic increase due
to a sudden drop in grazing pressure. With decreased grazing pressure , the
rate of accumulation of drift kelp jumps to approximately 92,000 kilograms
per month . As the total kelp biomass approaches canying capacity, the rate
of accumulation of standing kelp is reduced, which leads to a redu ction in
the accumulation of drift kelp. The accumulation rate slowly decreases to a
final rate of approximately 4,700 kilograms per month . After 5 years, drift
kelp accounts for 16% of the total kelp in the area with a final value of 1.7
million kilograms.
12.4. Conclusions
The dynamics of the kelp-urchin-otter equilibrium illustrates the cascading
effects that the recolonization of otters have had on other parts of the food
chain. The model above indicates that-given the relatively small study
area- significant short-term fluctuations in otter popul ations are to be expected as individual generations of otters move through their age cohorts.
Sudden, dramatic declines in otter population are to be expected, and are
not nece ssarily a sign of a lack of success of a recolonization program. As
12. Kelp, Urchin s, and Otters in the Californi a Coastal Region
1: Total Kelp Biomass
2: Standing Kelp Biomass
3: Drift Kelp Biomass
6000000.50
<::.-- - - +_- - - - - +-- - - - - 1
3, - - - + - - -3:----1
3
30.00
Months
15.00
45.00
60.00
FIGURE 12.9
drift-kelp curve in Figure 12.9. There are three segments of the curve: slow
growth after the initial month , rapid growth after large urchin extirpation,
and growth approaching canying capacity. The initial growth is due to increased urchin predation , which curbs the accumulation rate of drift kelp to
approximately 24,000 kilograms per month . As urchins are preyed upon by
otters, this rate tends to decrease. When the reproductive class of urchins is
wiped out by otters, drift-kelp biomass experiences a dramatic increase due
to a sudden drop in grazing pressure. With decreased grazing pressure , the
rate of accumulation of drift kelp jumps to approximately 92,000 kilograms
per month . As the total kelp biomass approaches canying capacity, the rate
of accumulation of standing kelp is reduced, which leads to a redu ction in
the accumulation of drift kelp. The accumulation rate slowly decreases to a
final rate of approximately 4,700 kilograms per month . After 5 years, drift
kelp accounts for 16% of the total kelp in the area with a final value of 1.7
million kilograms.
12.4. Conclusions
The dynamics of the kelp-urchin-otter equilibrium illustrates the cascading
effects that the recolonization of otters have had on other parts of the food
chain. The model above indicates that-given the relatively small study
area- significant short-term fluctuations in otter popul ations are to be expected as individual generations of otters move through their age cohorts.
Sudden, dramatic declines in otter population are to be expected, and are
not nece ssarily a sign of a lack of success of a recolonization program. As