

12.3. Results
239
lowed by a 4-month period of rapid growth . This rapid growth begins in
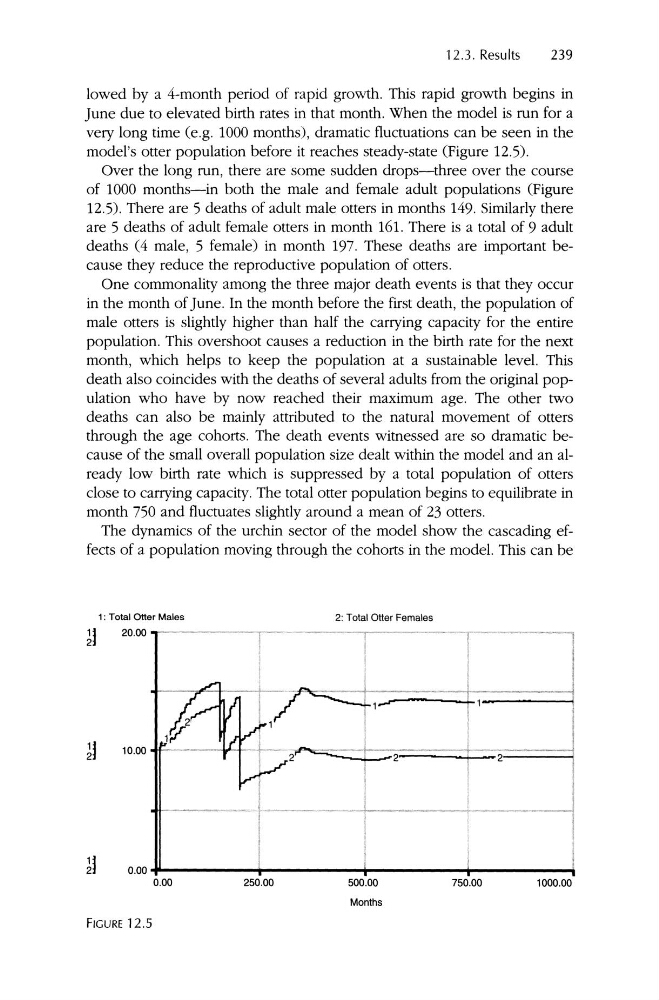
June due to elevated birth rates in that month. When the model is run for a
very long time (e .g, 1000 months), dramatic fluctuations can be seen in the
model's otter population before it reaches steady-state (Figure 12.5).
Over the long run , there are some sudden drops-three over the course
of 1000 months-in both the male and female adult populations (Figure
12.5), There are 5 deaths of adult male otters in months 149. Similarly there
are 5 deaths of adult female otters in month 161. There is a total of 9 adult
deaths (4 male, 5 female) in month 197. These deaths are important because they reduce the reproductive population of otters.
One commonality among the three major death events is that they occur
in the month of June. In the month before the first death, the population of
male otters is slightly higher than half the carrying capacity for the entire
population. This overshoot causes a reduction in the birth rate for the next
month , which helps to keep the population at a sustainable level. This
death also coincides with the deaths of several adults from the original population who have by now reached their maximum age . The other two
deaths can also be mainly attributed to the natural movement of otters
through the age cohorts . The death events witnessed are so dramatic because of the small overall population size dealt within the model and an already low birth rate which is suppressed by a total population of otters
close to carrying capacity. The total otter population begins to equilibrate in
month 750 and fluctuates slightly around a mean of 23 otters.
The dynamics of the urchin sector of the model show the cascading effects of a population moving through the cohorts in the model. This can be
1; Total Otter Males
20.00
2: Total Otter Females
. / '
r
- -
V
V
---IV
/2
l r
10.00
c,
c,
0.00
0.00
250 .00
500.00
Months
750.00
1000 .00
FIGURE 12.5
239
lowed by a 4-month period of rapid growth . This rapid growth begins in
June due to elevated birth rates in that month. When the model is run for a
very long time (e .g, 1000 months), dramatic fluctuations can be seen in the
model's otter population before it reaches steady-state (Figure 12.5).
Over the long run , there are some sudden drops-three over the course
of 1000 months-in both the male and female adult populations (Figure
12.5), There are 5 deaths of adult male otters in months 149. Similarly there
are 5 deaths of adult female otters in month 161. There is a total of 9 adult
deaths (4 male, 5 female) in month 197. These deaths are important because they reduce the reproductive population of otters.
One commonality among the three major death events is that they occur
in the month of June. In the month before the first death, the population of
male otters is slightly higher than half the carrying capacity for the entire
population. This overshoot causes a reduction in the birth rate for the next
month , which helps to keep the population at a sustainable level. This
death also coincides with the deaths of several adults from the original population who have by now reached their maximum age . The other two
deaths can also be mainly attributed to the natural movement of otters
through the age cohorts . The death events witnessed are so dramatic because of the small overall population size dealt within the model and an already low birth rate which is suppressed by a total population of otters
close to carrying capacity. The total otter population begins to equilibrate in
month 750 and fluctuates slightly around a mean of 23 otters.
The dynamics of the urchin sector of the model show the cascading effects of a population moving through the cohorts in the model. This can be
1; Total Otter Males
20.00
2: Total Otter Females
. / '
r
- -
V
V
---IV
/2
l r
10.00
c,
c,
0.00
0.00
250 .00
500.00
Months
750.00
1000 .00
FIGURE 12.5