

238
12. Kelp, Urchins, and Otters in the California Coastal Region
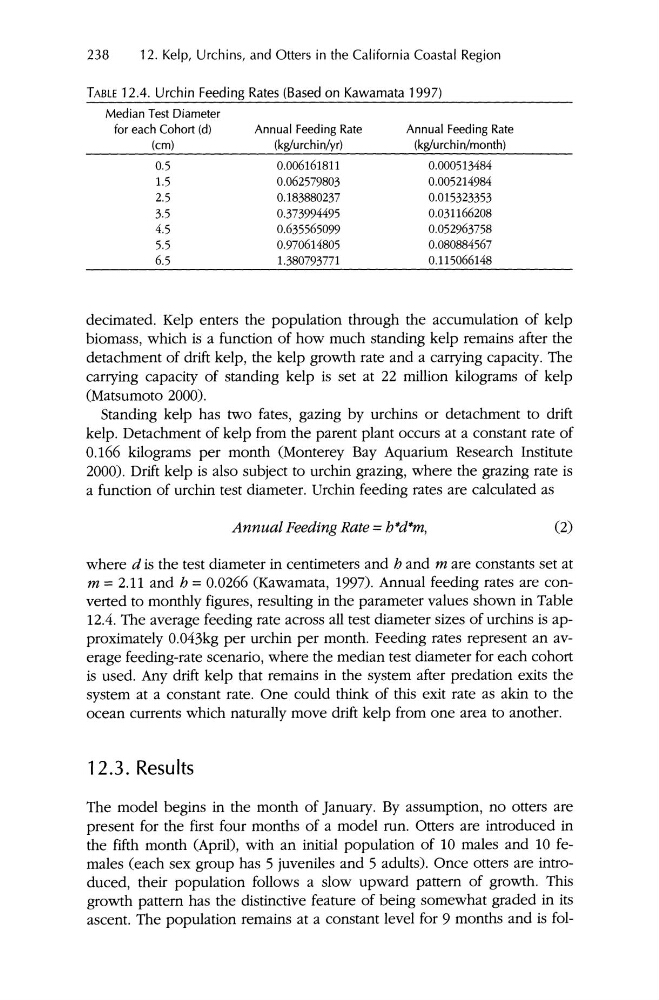
TABLE 12.4. Urchin Feeding Rates (Based on Kawamata 1997)
Median Test Diameter
for each Cohort (d)
(cm)
0.5
1.5
2.5
3.5
4.5
5.5
6.5
Annual Feeding Rate
(kg/urchin/yr)
0.006161811
0.062579803
0.183880237
0.373994495
0.635565099
0.970614805
1.380793771
Annua l Feeding Rate
(kg/urchin/month)
0.000513484
0.005214984
0.015323353
0.031166208
0.052963758
0.080884567
0.115066148
decimated. Kelp enters the population through the accumulation of kelp
biomass , which is a function of how much standing kelp remains after the
detachment of drift kelp , the kelp growth rate and a carrying capacity. The
carrying capacity of standing kelp is set at 22 million kilograms of kelp
(Matsumoto 2000).
Standing kelp has two fates, gazing by urchins or detachment to drift
kelp . Detachment of kelp from the parent plant occurs at a constant rate of
0.166 kilograms per month (Monterey Bay Aquarium Research Institute
2000). Drift kelp is also subject to urchin grazing, where the grazing rate is
a function of urchin test diameter . Urchin feeding rates are calculated as
Annual Feeding Rate=b'd'm,
(2)
where d is the test diameter in centimeters and hand m are constants set at
m = 2.11 and h = 0.0266 (Kawamata, 1997). Annual feeding rates are converted to monthly figures, resulting in the parameter values shown in Table
12.4. The average feeding rate across all test diameter sizes of urchins is approximately 0.043kg per urchin per month. Feeding rates represent an average feeding-rate scenario, where the median test diameter for each cohort
is used. Any drift kelp that remains in the system after predation exits the
system at a constant rate. One could think of this exit rate as akin to the
ocean currents which naturally move drift kelp from one area to another.
12.3. Results
The model begins in the month of January. By assumption, no otters are
present for the first four months of a model run. Otters are introduced in
the fifth month (April), with an initial population of 10 males and 10 females (each sex group has 5 juveniles and 5 adults). Once otters are introduced, their population follows a slow upward pattern of growth . This
growth pattern has the distinctive feature of being somewhat graded in its
ascent. The population remains at a constant level for 9 months and is fol-
12. Kelp, Urchins, and Otters in the California Coastal Region
TABLE 12.4. Urchin Feeding Rates (Based on Kawamata 1997)
Median Test Diameter
for each Cohort (d)
(cm)
0.5
1.5
2.5
3.5
4.5
5.5
6.5
Annual Feeding Rate
(kg/urchin/yr)
0.006161811
0.062579803
0.183880237
0.373994495
0.635565099
0.970614805
1.380793771
Annua l Feeding Rate
(kg/urchin/month)
0.000513484
0.005214984
0.015323353
0.031166208
0.052963758
0.080884567
0.115066148
decimated. Kelp enters the population through the accumulation of kelp
biomass , which is a function of how much standing kelp remains after the
detachment of drift kelp , the kelp growth rate and a carrying capacity. The
carrying capacity of standing kelp is set at 22 million kilograms of kelp
(Matsumoto 2000).
Standing kelp has two fates, gazing by urchins or detachment to drift
kelp . Detachment of kelp from the parent plant occurs at a constant rate of
0.166 kilograms per month (Monterey Bay Aquarium Research Institute
2000). Drift kelp is also subject to urchin grazing, where the grazing rate is
a function of urchin test diameter . Urchin feeding rates are calculated as
Annual Feeding Rate=b'd'm,
(2)
where d is the test diameter in centimeters and hand m are constants set at
m = 2.11 and h = 0.0266 (Kawamata, 1997). Annual feeding rates are converted to monthly figures, resulting in the parameter values shown in Table
12.4. The average feeding rate across all test diameter sizes of urchins is approximately 0.043kg per urchin per month. Feeding rates represent an average feeding-rate scenario, where the median test diameter for each cohort
is used. Any drift kelp that remains in the system after predation exits the
system at a constant rate. One could think of this exit rate as akin to the
ocean currents which naturally move drift kelp from one area to another.
12.3. Results
The model begins in the month of January. By assumption, no otters are
present for the first four months of a model run. Otters are introduced in
the fifth month (April), with an initial population of 10 males and 10 females (each sex group has 5 juveniles and 5 adults). Once otters are introduced, their population follows a slow upward pattern of growth . This
growth pattern has the distinctive feature of being somewhat graded in its
ascent. The population remains at a constant level for 9 months and is fol-