

8.2. Model Formulation
147
EJ====::==9
PERCENT LIGHT
An
Julian Day
1min
TOTAL DINOFLAGELLATES
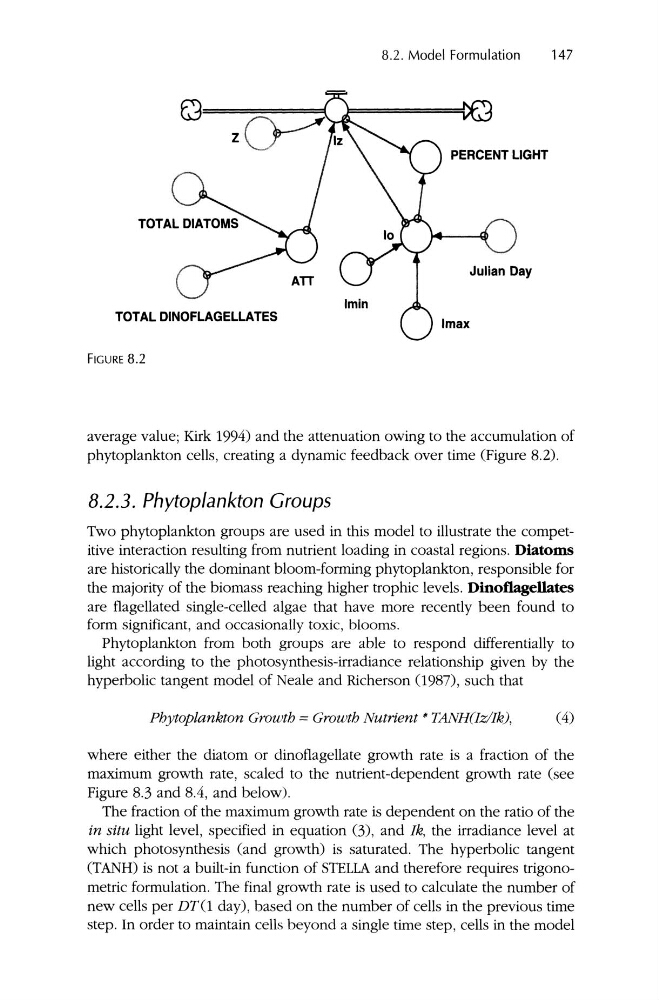
FIGURE 8.2
average value ; Kirk 1994) and the attenuation owing to the accumulation of
phytoplankton cells, creating a dynamic feedback over time (Figure 8.2).
8.2.3. Phytoplankton Groups
Two phytoplankton groups are used in this model to illustrate the competitive interaction resulting from nutrient loading in coastal regions. Diatoms
are historically the dominant bloom-forming phytoplankton, responsible for
the majority of the biomass reaching higher trophic levels. Dinoflagellates
are flagellated single-celled algae that have more recently been found to
form significant, and occasionally toxic, blooms .
Phytoplankton from both groups are able to respond differentially to
light according to the photosynthesis-irradiance relationship given by the
hyperbolic tangent model of Neale and Richerson (987), such that
Phytoplankton Growth =Growth Nutrient * TANH(IzIIkJ,
(4)
where either the diatom or dinoflagellate growth rate is a fraction of the
maximum growth rate, scaled to the nutrient-dependent growth rate (see
Figure 8.3 and 8.4, and below).
The fraction of the maximum growth rate is dependent on the ratio of the
in situ light level, specified in equation (3), and Ik, the irradiance level at
which photosynthesis (and growth) is saturated. The hyperbolic tangent
(TANH) is not a built-in function of STELLA and therefore requires trigonometric formulation . The final growth rate is used to calculate the number of
new cells per DTO day) , based on the number of cells in the previous time
step. In order to maintain cells beyond a single time step, cells in the model
147
EJ====::==9
PERCENT LIGHT
An
Julian Day
1min
TOTAL DINOFLAGELLATES
FIGURE 8.2
average value ; Kirk 1994) and the attenuation owing to the accumulation of
phytoplankton cells, creating a dynamic feedback over time (Figure 8.2).
8.2.3. Phytoplankton Groups
Two phytoplankton groups are used in this model to illustrate the competitive interaction resulting from nutrient loading in coastal regions. Diatoms
are historically the dominant bloom-forming phytoplankton, responsible for
the majority of the biomass reaching higher trophic levels. Dinoflagellates
are flagellated single-celled algae that have more recently been found to
form significant, and occasionally toxic, blooms .
Phytoplankton from both groups are able to respond differentially to
light according to the photosynthesis-irradiance relationship given by the
hyperbolic tangent model of Neale and Richerson (987), such that
Phytoplankton Growth =Growth Nutrient * TANH(IzIIkJ,
(4)
where either the diatom or dinoflagellate growth rate is a fraction of the
maximum growth rate, scaled to the nutrient-dependent growth rate (see
Figure 8.3 and 8.4, and below).
The fraction of the maximum growth rate is dependent on the ratio of the
in situ light level, specified in equation (3), and Ik, the irradiance level at
which photosynthesis (and growth) is saturated. The hyperbolic tangent
(TANH) is not a built-in function of STELLA and therefore requires trigonometric formulation . The final growth rate is used to calculate the number of
new cells per DTO day) , based on the number of cells in the previous time
step. In order to maintain cells beyond a single time step, cells in the model