

220.00
· · ·
·
· · · ·
.
. . .
. . . .
·
· ·
.
. .
7,5 Model Results and Discussion
1-5 : : 3IJr fact? Ct v . Surface Ft?
.. . .... .. . .. .. . . ... . ... . .. · . . .. .... . . ... ..
. ..... .. .. ..
· ·
· ·
. .
.
· ·
· ·
. .
.
·
·
. .
. .
·
· · ·
. . . .
137
+'
o
(1,0
I...
:;:,
00
2
.
"1"
"1"
:
:
.] ·1············· 1· · ···········j
.
218.00+-----i,..----;.----+---..-ot
0.00
1.50e-06
3 .00e-06
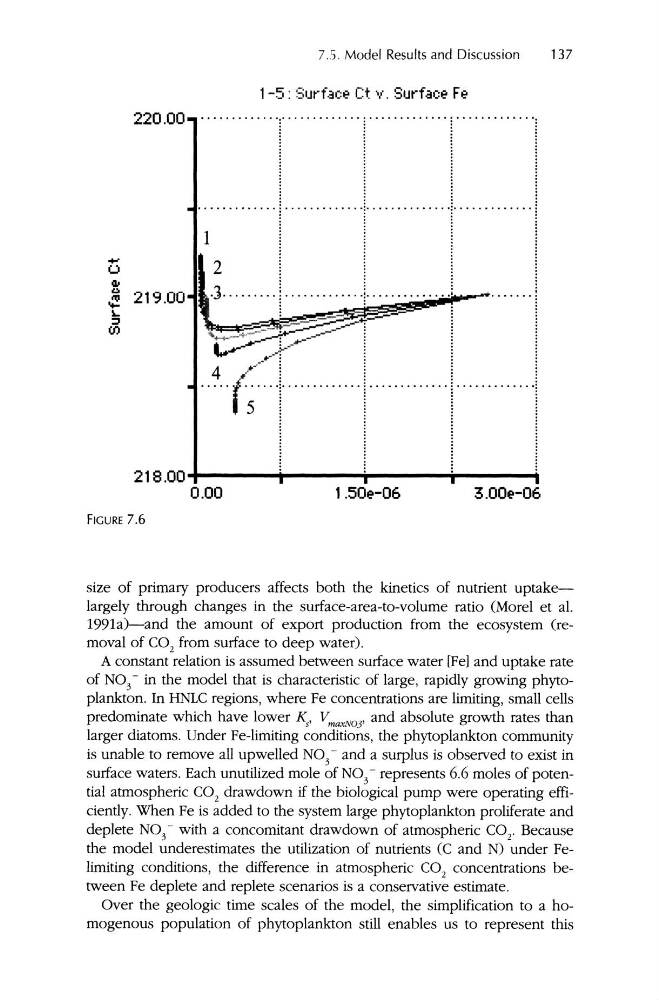
FIGURE 7.6
size of primary producers affects both the kinetics of nutrient uptakelargely through changes in the surface-area-to-volume ratio (Morel et al.
1991a)-and the amount of export production from the ecosystem (removal of CO 2 from surface to deep water).
A constant relation is assumed between surface water [Fe] and uptake rate
of N0
predominate which have lower K
- in the model that is characteristic of large, rapidly growing phytoV
3
s
maxNo3
plankton . In HNLC regions, where Fe concentrations are limiting, small cells
'
' and absolute growth rates than
larger diatoms. Under Fe-limiting conditions, the phytoplankton community
is unable to remove all upwelled N0 3
- and a surplu s is observed to exist in
surface waters. Each unutilized mole of N0 3
- represents 6.6 moles of potential atmospheric CO 2 drawdown if the biological pump were ope rating efficiently. When Fe is added to the system large phytoplankton proliferate and
deplete N0 3
- with a concomitant drawdown of atmospheric CO 2
, Because
the model underestimates the utilization of nutrients (C and N) under Felimiting conditions, the difference in atmospheric CO 2 concentrations betwee n Fe deplete and replete scenarios is a conservative estimate.
Over the geologic time scales of the model , the simplification to a homogen ous population of phytoplankton still enab les us to represent this
· · ·
·
· · · ·
.
. . .
. . . .
·
· ·
.
. .
7,5 Model Results and Discussion
1-5 : : 3IJr fact? Ct v . Surface Ft?
.. . .... .. . .. .. . . ... . ... . .. · . . .. .... . . ... ..
. ..... .. .. ..
· ·
· ·
. .
.
· ·
· ·
. .
.
·
·
. .
. .
·
· · ·
. . . .
137
+'
o
(1,0
I...
:;:,
00
2
.
"1"
"1"
:
:
.] ·1············· 1· · ···········j
.
218.00+-----i,..----;.----+---..-ot
0.00
1.50e-06
3 .00e-06
FIGURE 7.6
size of primary producers affects both the kinetics of nutrient uptakelargely through changes in the surface-area-to-volume ratio (Morel et al.
1991a)-and the amount of export production from the ecosystem (removal of CO 2 from surface to deep water).
A constant relation is assumed between surface water [Fe] and uptake rate
of N0
predominate which have lower K
- in the model that is characteristic of large, rapidly growing phytoV
3
s
maxNo3
plankton . In HNLC regions, where Fe concentrations are limiting, small cells
'
' and absolute growth rates than
larger diatoms. Under Fe-limiting conditions, the phytoplankton community
is unable to remove all upwelled N0 3
- and a surplu s is observed to exist in
surface waters. Each unutilized mole of N0 3
- represents 6.6 moles of potential atmospheric CO 2 drawdown if the biological pump were ope rating efficiently. When Fe is added to the system large phytoplankton proliferate and
deplete N0 3
- with a concomitant drawdown of atmospheric CO 2
, Because
the model underestimates the utilization of nutrients (C and N) under Felimiting conditions, the difference in atmospheric CO 2 concentrations betwee n Fe deplete and replete scenarios is a conservative estimate.
Over the geologic time scales of the model , the simplification to a homogen ous population of phytoplankton still enab les us to represent this