

10 Status and Future Perspectives in Aquaculture
301
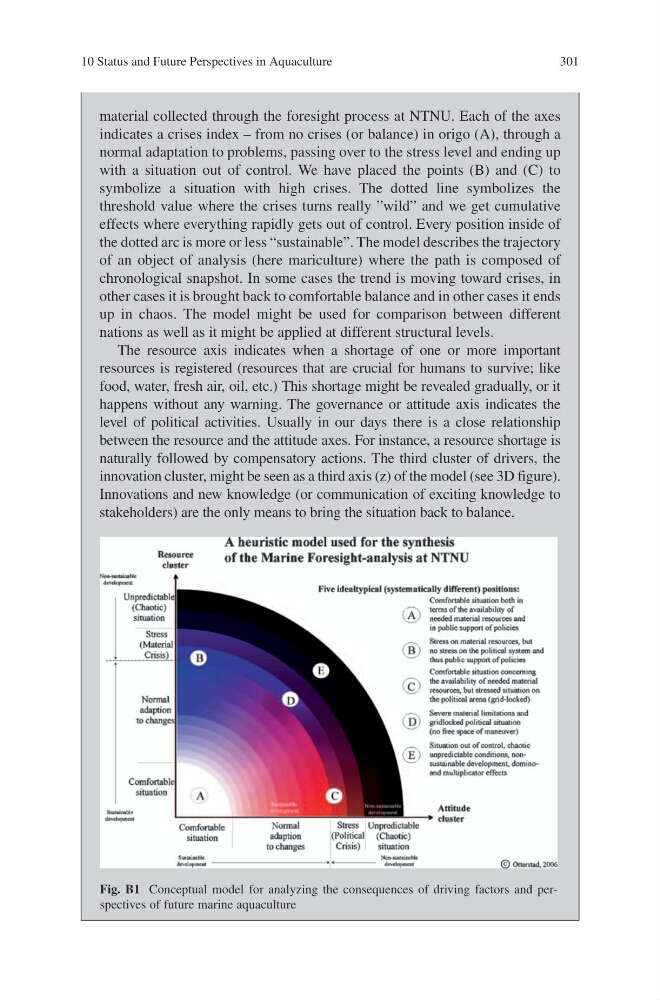
material collected through the foresight process at NTNU. Each of the axes
indicates a crises index – from no crises (or balance) in origo (A), through a
normal adaptation to problems, passing over to the stress level and ending up
with a situation out of control. We have placed the points (B) and (C) to
symbolize a situation with high crises. The dotted line symbolizes the
threshold value where the crises turns really ”wild” and we get cumulative
effects where everything rapidly gets out of control. Every position inside of
the dotted arc is more or less “sustainable”. The model describes the trajectory
of an object of analysis (here mariculture) where the path is composed of
chronological snapshot. In some cases the trend is moving toward crises, in
other cases it is brought back to comfortable balance and in other cases it ends
up in chaos. The model might be used for comparison between different
nations as well as it might be applied at different structural levels.
The resource axis indicates when a shortage of one or more important
resources is registered (resources that are crucial for humans to survive; like
food, water, fresh air, oil, etc.) This shortage might be revealed gradually, or it
happens without any warning. The governance or attitude axis indicates the
level of political activities. Usually in our days there is a close relationship
between the resource and the attitude axes. For instance, a resource shortage is
naturally followed by compensatory actions. The third cluster of drivers, the
innovation cluster, might be seen as a third axis (z) of the model (see 3D figure).
Innovations and new knowledge (or communication of exciting knowledge to
stakeholders) are the only means to bring the situation back to balance.
Fig. B1 Conceptual model for analyzing the consequences of driving factors and perspectives of future marine aquaculture
301
material collected through the foresight process at NTNU. Each of the axes
indicates a crises index – from no crises (or balance) in origo (A), through a
normal adaptation to problems, passing over to the stress level and ending up
with a situation out of control. We have placed the points (B) and (C) to
symbolize a situation with high crises. The dotted line symbolizes the
threshold value where the crises turns really ”wild” and we get cumulative
effects where everything rapidly gets out of control. Every position inside of
the dotted arc is more or less “sustainable”. The model describes the trajectory
of an object of analysis (here mariculture) where the path is composed of
chronological snapshot. In some cases the trend is moving toward crises, in
other cases it is brought back to comfortable balance and in other cases it ends
up in chaos. The model might be used for comparison between different
nations as well as it might be applied at different structural levels.
The resource axis indicates when a shortage of one or more important
resources is registered (resources that are crucial for humans to survive; like
food, water, fresh air, oil, etc.) This shortage might be revealed gradually, or it
happens without any warning. The governance or attitude axis indicates the
level of political activities. Usually in our days there is a close relationship
between the resource and the attitude axes. For instance, a resource shortage is
naturally followed by compensatory actions. The third cluster of drivers, the
innovation cluster, might be seen as a third axis (z) of the model (see 3D figure).
Innovations and new knowledge (or communication of exciting knowledge to
stakeholders) are the only means to bring the situation back to balance.
Fig. B1 Conceptual model for analyzing the consequences of driving factors and perspectives of future marine aquaculture