

10 Status and Future Perspectives in Aquaculture
299
There are a number of predictions made for the future needs for seafood and the
production yields from aquaculture (Ye 1999, Wijkström 2003, IFPRI-model 2020
2 ).
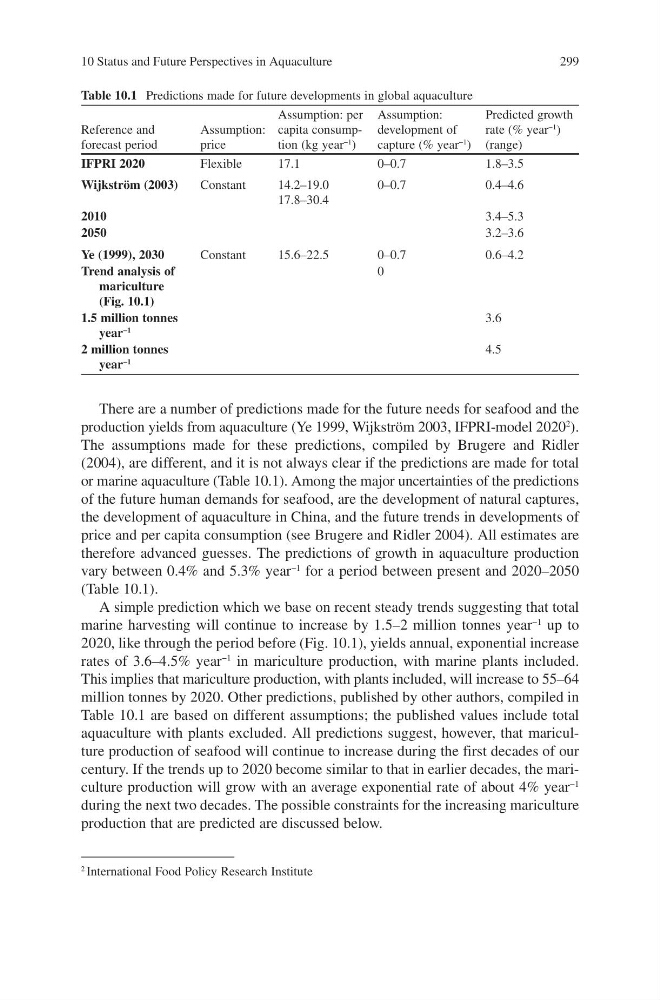
The assumptions made for these predictions, compiled by Brugere and Ridler
(2004), are different, and it is not always clear if the predictions are made for total
or marine aquaculture (Table 10.1). Among the major uncertainties of the predictions
of the future human demands for seafood, are the development of natural captures,
the development of aquaculture in China, and the future trends in developments of
price and per capita consumption (see Brugere and Ridler 2004). All estimates are
therefore advanced guesses. The predictions of growth in aquaculture production
vary between 0.4% and 5.3% year
−1 for a period between present and 2020–2050
(Table 10.1).
A simple prediction which we base on recent steady trends suggesting that total
marine harvesting will continue to increase by 1.5–2 million tonnes year
−1 up to
2020, like through the period before (Fig. 10.1), yields annual, exponential increase
rates of 3.6–4.5% year
−1 in mariculture production, with marine plants included.
This implies that mariculture production, with plants included, will increase to 55–64
million tonnes by 2020. Other predictions, published by other authors, compiled in
Table 10.1 are based on different assumptions; the published values include total
aquaculture with plants excluded. All predictions suggest, however, that mariculture production of seafood will continue to increase during the first decades of our
century. If the trends up to 2020 become similar to that in earlier decades, the mariculture production will grow with an average exponential rate of about 4% year
−1
during the next two decades. The possible constraints for the increasing mariculture
production that are predicted are discussed below.
Table 10.1 Predictions made for future developments in global aquaculture
Reference and
forecast period
Assumption:
price
Assumption: per
capita consumption (kg year
−1 )
Assumption:
development of
capture (% year
−1 )
Predicted growth
rate (% year
−1 )
(range)
IFPRI 2020
Flexible
17.1
0–0.7
1.8–3.5
Wijkström (2003)
Constant
14.2–19.0
17.8–30.4
0–0.7
0.4–4.6
2010
3.4–5.3
2050
3.2–3.6
Ye (1999), 2030
Constant
15.6–22.5
0–0.7
0.6–4.2
Trend analysis of
mariculture
(Fig. 10.1)
0
1.5 million tonnes
year
−1
3.6
2 million tonnes
year
−1
4.5
2 International Food Policy Research Institute
299
There are a number of predictions made for the future needs for seafood and the
production yields from aquaculture (Ye 1999, Wijkström 2003, IFPRI-model 2020
2 ).
The assumptions made for these predictions, compiled by Brugere and Ridler
(2004), are different, and it is not always clear if the predictions are made for total
or marine aquaculture (Table 10.1). Among the major uncertainties of the predictions
of the future human demands for seafood, are the development of natural captures,
the development of aquaculture in China, and the future trends in developments of
price and per capita consumption (see Brugere and Ridler 2004). All estimates are
therefore advanced guesses. The predictions of growth in aquaculture production
vary between 0.4% and 5.3% year
−1 for a period between present and 2020–2050
(Table 10.1).
A simple prediction which we base on recent steady trends suggesting that total
marine harvesting will continue to increase by 1.5–2 million tonnes year
−1 up to
2020, like through the period before (Fig. 10.1), yields annual, exponential increase
rates of 3.6–4.5% year
−1 in mariculture production, with marine plants included.
This implies that mariculture production, with plants included, will increase to 55–64
million tonnes by 2020. Other predictions, published by other authors, compiled in
Table 10.1 are based on different assumptions; the published values include total
aquaculture with plants excluded. All predictions suggest, however, that mariculture production of seafood will continue to increase during the first decades of our
century. If the trends up to 2020 become similar to that in earlier decades, the mariculture production will grow with an average exponential rate of about 4% year
−1
during the next two decades. The possible constraints for the increasing mariculture
production that are predicted are discussed below.
Table 10.1 Predictions made for future developments in global aquaculture
Reference and
forecast period
Assumption:
price
Assumption: per
capita consumption (kg year
−1 )
Assumption:
development of
capture (% year
−1 )
Predicted growth
rate (% year
−1 )
(range)
IFPRI 2020
Flexible
17.1
0–0.7
1.8–3.5
Wijkström (2003)
Constant
14.2–19.0
17.8–30.4
0–0.7
0.4–4.6
2010
3.4–5.3
2050
3.2–3.6
Ye (1999), 2030
Constant
15.6–22.5
0–0.7
0.6–4.2
Trend analysis of
mariculture
(Fig. 10.1)
0
1.5 million tonnes
year
−1
3.6
2 million tonnes
year
−1
4.5
2 International Food Policy Research Institute