

538
12 Species Case Studies
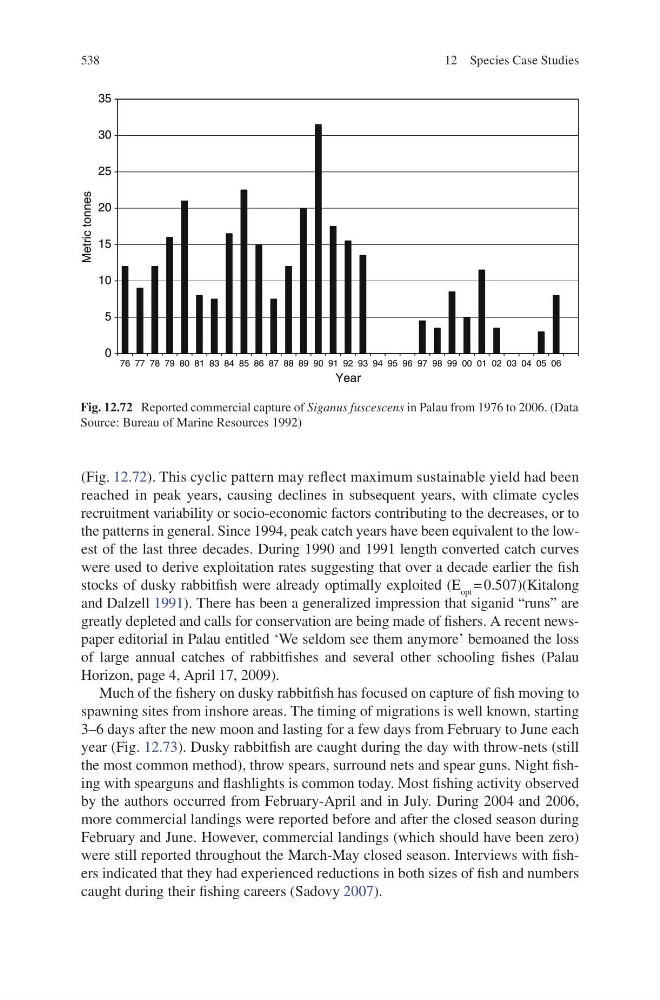
(Fig. 12.72 ). This cyclic pattern may refl ect maximum sustainable yield had been
reached in peak years, causing declines in subsequent years, with climate cycles
recruitment variability or socio-economic factors contributing to the decreases, or to
the patterns in general. Since 1994, peak catch years have been equivalent to the lowest of the last three decades. During 1990 and 1991 length converted catch curves
were used to derive exploitation rates suggesting that over a decade earlier the fi sh
stocks of dusky rabbitfi sh were already optimally exploited (E opt = 0.507)(Kitalong
and Dalzell 1991 ) . There has been a generalized impression that siganid “runs” are
greatly depleted and calls for conservation are being made of fi shers. A recent newspaper editorial in Palau entitled ‘We seldom see them anymore’ bemoaned the loss
of large annual catches of rabbitfi shes and several other schooling fi shes (Palau
Horizon, page 4, April 17, 2009).
Much of the fi shery on dusky rabbitfi sh has focused on capture of fi sh moving to
spawning sites from inshore areas. The timing of migrations is well known, starting
3–6 days after the new moon and lasting for a few days from February to June each
year (Fig. 12.73 ). Dusky rabbitfi sh are caught during the day with throw-nets (still
the most common method), throw spears, surround nets and spear guns. Night fi shing with spearguns and fl ashlights is common today. Most fi shing activity observed
by the authors occurred from February-April and in July. During 2004 and 2006,
more commercial landings were reported before and after the closed season during
February and June. However, commercial landings (which should have been zero)
were still reported throughout the March-May closed season. Interviews with fi shers indicated that they had experienced reductions in both sizes of fi sh and numbers
caught during their fi shing careers (Sadovy 2007 ) .
0
5
10
15
20
25
30
35
76 77 78 79 80 81 83 84 85 86 87 88 89 90 91 92 93 94 95 96 97 98 99 00 01 02 03 04 05 06
Metric tonnes
Year
Fig. 12.72 Reported commercial capture of Siganus fuscescens in Palau from 1976 to 2006. (Data
Source: Bureau of Marine Resources 1992)
12 Species Case Studies
(Fig. 12.72 ). This cyclic pattern may refl ect maximum sustainable yield had been
reached in peak years, causing declines in subsequent years, with climate cycles
recruitment variability or socio-economic factors contributing to the decreases, or to
the patterns in general. Since 1994, peak catch years have been equivalent to the lowest of the last three decades. During 1990 and 1991 length converted catch curves
were used to derive exploitation rates suggesting that over a decade earlier the fi sh
stocks of dusky rabbitfi sh were already optimally exploited (E opt = 0.507)(Kitalong
and Dalzell 1991 ) . There has been a generalized impression that siganid “runs” are
greatly depleted and calls for conservation are being made of fi shers. A recent newspaper editorial in Palau entitled ‘We seldom see them anymore’ bemoaned the loss
of large annual catches of rabbitfi shes and several other schooling fi shes (Palau
Horizon, page 4, April 17, 2009).
Much of the fi shery on dusky rabbitfi sh has focused on capture of fi sh moving to
spawning sites from inshore areas. The timing of migrations is well known, starting
3–6 days after the new moon and lasting for a few days from February to June each
year (Fig. 12.73 ). Dusky rabbitfi sh are caught during the day with throw-nets (still
the most common method), throw spears, surround nets and spear guns. Night fi shing with spearguns and fl ashlights is common today. Most fi shing activity observed
by the authors occurred from February-April and in July. During 2004 and 2006,
more commercial landings were reported before and after the closed season during
February and June. However, commercial landings (which should have been zero)
were still reported throughout the March-May closed season. Interviews with fi shers indicated that they had experienced reductions in both sizes of fi sh and numbers
caught during their fi shing careers (Sadovy 2007 ) .
0
5
10
15
20
25
30
35
76 77 78 79 80 81 83 84 85 86 87 88 89 90 91 92 93 94 95 96 97 98 99 00 01 02 03 04 05 06
Metric tonnes
Year
Fig. 12.72 Reported commercial capture of Siganus fuscescens in Palau from 1976 to 2006. (Data
Source: Bureau of Marine Resources 1992)