

476
12 Species Case Studies
12.12.4 Lessons Learnt in Managing Snapper During
Spawning Season and Data Gaps
Size and bag limits do not limit recreational fi shing effort and on their own have
only very limited effect on reducing the overall level of catch or fi shing mortality.
The size and bag limits that have been used since 1998 have resulted in very large
numbers of snapper being released each year (~40,000 in all three areas combined,
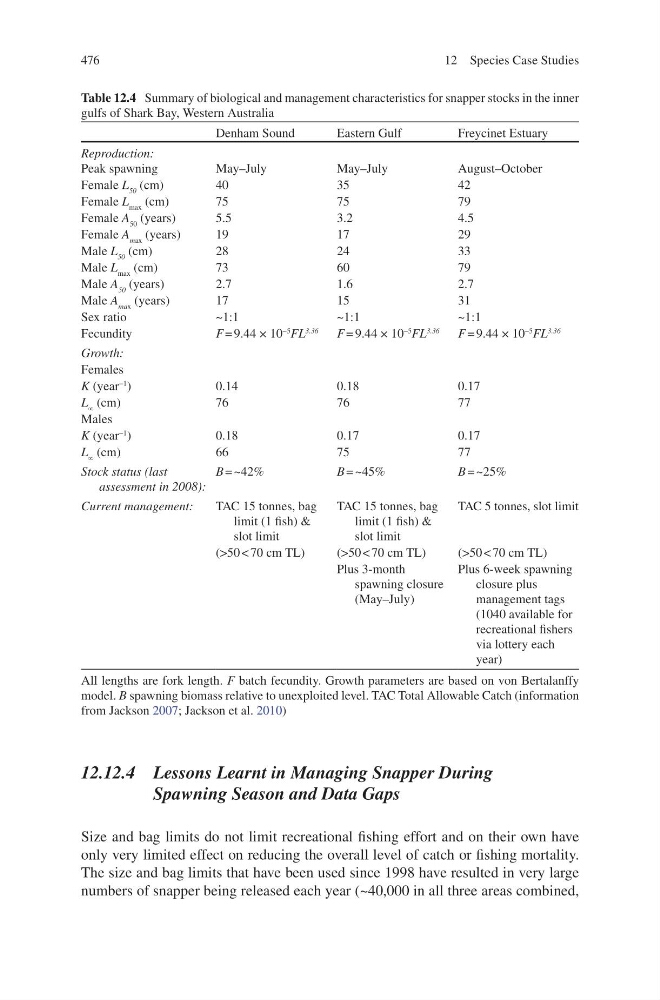
Table 12.4 Summary of biological and management characteristics for snapper stocks in the inner
gulfs of Shark Bay, Western Australia
Denham Sound
Eastern Gulf
Freycinet Estuary
Reproduction:
Peak spawning
May–July
May–July
August–October
Female L 50 (cm)
40
35
42
Female L max (cm)
75
75
79
Female A 50 (years)
5.5
3.2
4.5
Female A m ax (years)
19
17
29
Male L 50 (cm)
28
24
33
Male L max (cm)
73
60
79
Male A 50 (years)
2.7
1.6
2.7
Male A ma x (years)
17
15
31
Sex ratio
~1:1
~1:1
~1:1
Fecundity
F = 9.44 × 10
−5 FL
3.36
F = 9.44 × 10
−5 FL
3.36
F = 9.44 × 10
−5
FL
3.36
Growth:
Females
K (year
−1
)
0.14
0.18
0.17
L ∞ (cm)
76
76
77
Males
K (year
−1
)
0.18
0.17
0.17
L ∞ (cm)
66
75
77
Stock status (last
assessment in 2008):
B = ~42%
B = ~45%
B = ~25%
Current management:
TAC 15 tonnes, bag
limit (1 fi sh) &
slot limit
TAC 15 tonnes, bag
limit (1 fi sh) &
slot limit
TAC 5 tonnes, slot limit
(>50 < 70 cm TL)
(>50 < 70 cm TL)
(>50 < 70 cm TL)
Plus 3-month
spawning closure
(May–July)
Plus 6-week spawning
closure plus
management tags
(1040 available for
recreational fi shers
via lottery each
year)
All lengths are fork length. F batch fecundity. Growth parameters are based on von Bertalanffy
model. B spawning biomass relative to unexploited level. TAC Total Allowable Catch (information
from Jackson 2007 ; Jackson et al. 2010 )
12 Species Case Studies
12.12.4 Lessons Learnt in Managing Snapper During
Spawning Season and Data Gaps
Size and bag limits do not limit recreational fi shing effort and on their own have
only very limited effect on reducing the overall level of catch or fi shing mortality.
The size and bag limits that have been used since 1998 have resulted in very large
numbers of snapper being released each year (~40,000 in all three areas combined,
Table 12.4 Summary of biological and management characteristics for snapper stocks in the inner
gulfs of Shark Bay, Western Australia
Denham Sound
Eastern Gulf
Freycinet Estuary
Reproduction:
Peak spawning
May–July
May–July
August–October
Female L 50 (cm)
40
35
42
Female L max (cm)
75
75
79
Female A 50 (years)
5.5
3.2
4.5
Female A m ax (years)
19
17
29
Male L 50 (cm)
28
24
33
Male L max (cm)
73
60
79
Male A 50 (years)
2.7
1.6
2.7
Male A ma x (years)
17
15
31
Sex ratio
~1:1
~1:1
~1:1
Fecundity
F = 9.44 × 10
−5 FL
3.36
F = 9.44 × 10
−5 FL
3.36
F = 9.44 × 10
−5
FL
3.36
Growth:
Females
K (year
−1
)
0.14
0.18
0.17
L ∞ (cm)
76
76
77
Males
K (year
−1
)
0.18
0.17
0.17
L ∞ (cm)
66
75
77
Stock status (last
assessment in 2008):
B = ~42%
B = ~45%
B = ~25%
Current management:
TAC 15 tonnes, bag
limit (1 fi sh) &
slot limit
TAC 15 tonnes, bag
limit (1 fi sh) &
slot limit
TAC 5 tonnes, slot limit
(>50 < 70 cm TL)
(>50 < 70 cm TL)
(>50 < 70 cm TL)
Plus 3-month
spawning closure
(May–July)
Plus 6-week spawning
closure plus
management tags
(1040 available for
recreational fi shers
via lottery each
year)
All lengths are fork length. F batch fecundity. Growth parameters are based on von Bertalanffy
model. B spawning biomass relative to unexploited level. TAC Total Allowable Catch (information
from Jackson 2007 ; Jackson et al. 2010 )