

314
P.L. Colin
generated compared with visual estimates. Despite these efforts, the accuracy of the
estimates are hard to assess (for alternative method with same species see Sala et al.
2001 ). Methodologies need to be developed to assist in counting three dimensional
spaces with fi sh. Rand et al. ( 2006 ) used stereo images of a grouper aggregation to
provide fi sh abundance and length information and show the potential for these
types of methods.
To ensure that surveys can be repeated in future and that fi sh counts are meaningfully collected, UVC surveys need to include information detailing exactly what
area was surveyed and how data were collected. For example, census data in
Johannes et al. ( 1999 ) are an example of the problems of doing replication when
transects are not clearly identifi ed and survey methods are changed during the work.
Although they identifi ed “core areas” for each of three grouper aggregation sites in
Palau, each site having three species occurring and defi ned them as “to include the
largest proportion of the aggregation it was possible to count on a single SCUBA
tank”, “core areas” were not identifi ed on maps, by geographic coordinates nor
were their areas or lengths of transects identifi ed. Of the three aggregation sites
surveyed, one was small enough the entire site was covered during each survey,
while the other two were too large or deep to be totally surveyed. At times the aggregation extended beyond the “core area” at two sites and fi sh data from outside the
core area were sometimes added to counts. Fish abundance data were reported only
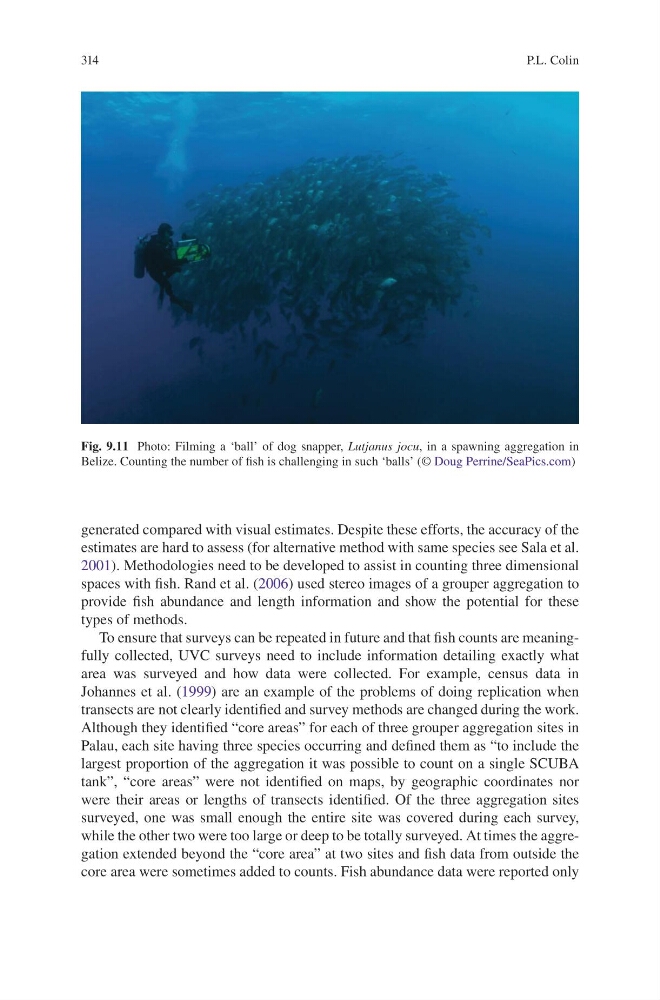
Fig. 9.11 Photo: Filming a ‘ball’ of dog snapper, Lutjanus jocu , in a spawning aggregation in
Belize. Counting the number of fi sh is challenging in such ‘balls’ (© Doug Perrine/SeaPics.com )
P.L. Colin
generated compared with visual estimates. Despite these efforts, the accuracy of the
estimates are hard to assess (for alternative method with same species see Sala et al.
2001 ). Methodologies need to be developed to assist in counting three dimensional
spaces with fi sh. Rand et al. ( 2006 ) used stereo images of a grouper aggregation to
provide fi sh abundance and length information and show the potential for these
types of methods.
To ensure that surveys can be repeated in future and that fi sh counts are meaningfully collected, UVC surveys need to include information detailing exactly what
area was surveyed and how data were collected. For example, census data in
Johannes et al. ( 1999 ) are an example of the problems of doing replication when
transects are not clearly identifi ed and survey methods are changed during the work.
Although they identifi ed “core areas” for each of three grouper aggregation sites in
Palau, each site having three species occurring and defi ned them as “to include the
largest proportion of the aggregation it was possible to count on a single SCUBA
tank”, “core areas” were not identifi ed on maps, by geographic coordinates nor
were their areas or lengths of transects identifi ed. Of the three aggregation sites
surveyed, one was small enough the entire site was covered during each survey,
while the other two were too large or deep to be totally surveyed. At times the aggregation extended beyond the “core area” at two sites and fi sh data from outside the
core area were sometimes added to counts. Fish abundance data were reported only
Fig. 9.11 Photo: Filming a ‘ball’ of dog snapper, Lutjanus jocu , in a spawning aggregation in
Belize. Counting the number of fi sh is challenging in such ‘balls’ (© Doug Perrine/SeaPics.com )