

313
9 Studying and Monitoring Aggregating Species
aggregation using topographic reference points and marker lines at known positions,
the numbers of fi sh within cubical volumes of the aggregation (they indicate using
a (3.3 m)
3 cube), extrapolating to the total volume of the aggregation and averaging
the estimates. During a typical survey divers conducted at least ten abundance estimates. Multiple daily counts were averaged. Video techniques, either fi lming compact aggregations from one point or swimming the length of the elongate aggregation
with the camera aimed at the aggregation in one clip were applied and the numbers
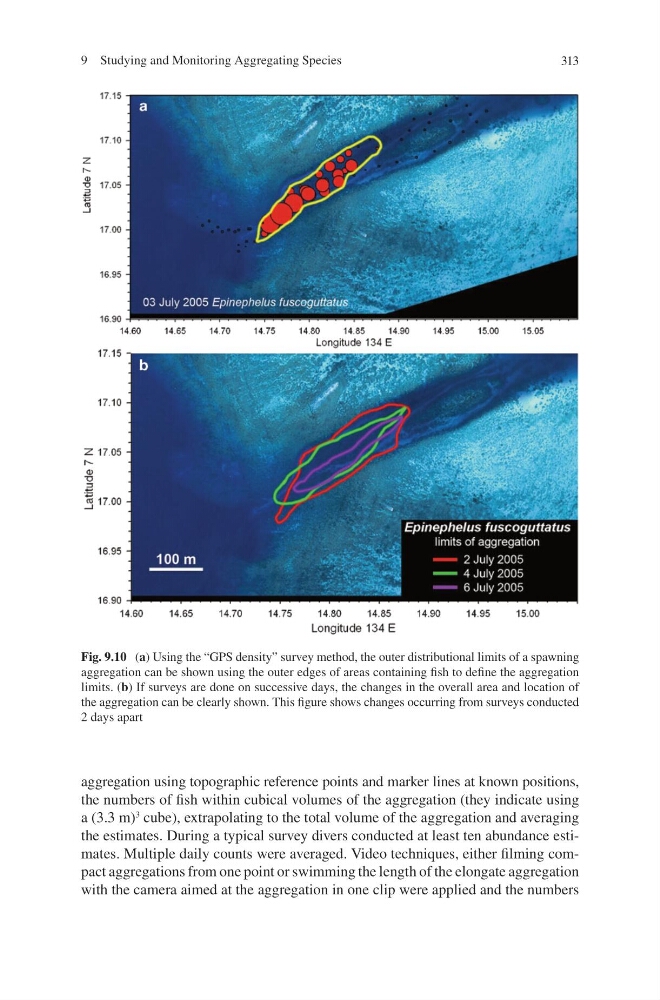
Fig. 9.10 ( a ) Using the “GPS density” survey method, the outer distributional limits of a spawning
aggregation can be shown using the outer edges of areas containing fi sh to defi ne the aggregation
limits. ( b ) If surveys are done on successive days, the changes in the overall area and location of
the aggregation can be clearly shown. This fi gure shows changes occurring from surveys conducted
2 days apart
9 Studying and Monitoring Aggregating Species
aggregation using topographic reference points and marker lines at known positions,
the numbers of fi sh within cubical volumes of the aggregation (they indicate using
a (3.3 m)
3 cube), extrapolating to the total volume of the aggregation and averaging
the estimates. During a typical survey divers conducted at least ten abundance estimates. Multiple daily counts were averaged. Video techniques, either fi lming compact aggregations from one point or swimming the length of the elongate aggregation
with the camera aimed at the aggregation in one clip were applied and the numbers
Fig. 9.10 ( a ) Using the “GPS density” survey method, the outer distributional limits of a spawning
aggregation can be shown using the outer edges of areas containing fi sh to defi ne the aggregation
limits. ( b ) If surveys are done on successive days, the changes in the overall area and location of
the aggregation can be clearly shown. This fi gure shows changes occurring from surveys conducted
2 days apart