

253
8 Fishery and Biological Implications of Fishing Spawning Aggregations…
contributed over 50% of landed catch from line-boats out of Durban harbour (Garratt
1996 ; Penney et al. 1999 ) . By the late 1960s, catches in the main fi shing area, KwaZuluNatal (KZN), had collapsed and after several failed management interventions during
the 1980s, a moratorium was placed on the species in 1998 (Mann 2007 ) .
Although large (up to 120 cm TL), the seventy-four is not the largest sea bream in
S. Africa. However, it has one of the shortest and most predictable spawning seasons
of the South African sea bream assemblage, appears to be the most threatened sea
bream and its collapse is one of the best documented examples of severe overfi shing
in S. African waters (reviewed in Mann 2007 ) . Its large spawning aggregations once
lasted from July to November and were heavily fi shed leading to marked declines in
catches and, ultimately, the need for management. However, the species showed little
recovery despite a fi shing moratorium. While there are positive indications of larger
adults in KZN and increased abundance of juveniles in the Eastern Cape, poaching
continues and the high price paid for this desirable, and now rare, fi sh means the
greatest threat to its recovery is the lack of effective enforcement (Mann 2007 ) .
Another sea bream, the red steenbras ( Petrus rupestris ) has suffered a similar fate.
Although its spawning aggregations are less well known; experienced fi shers strongly
indicate that this species aggregates during its spawning periods (August-November)
when the largest catches are made (Bruce Mann personal communication 2009).
The croakers include many highly valued species aggregating to spawn, typically
in coastal or estuarine areas and which are targeted at this time by commercial or
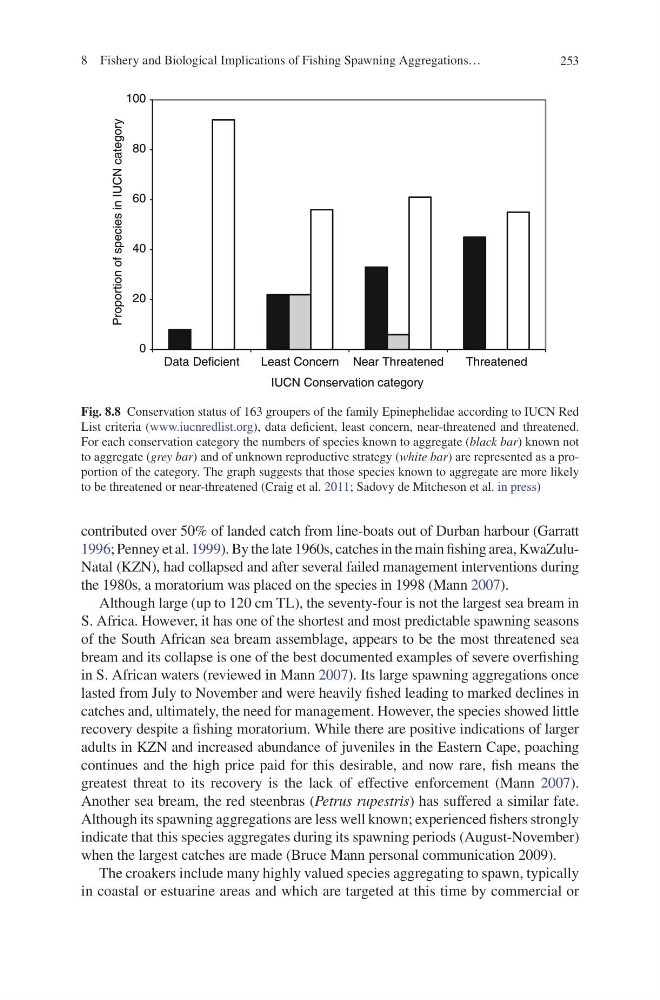
Fig. 8.8 Conservation status of 163 groupers of the family Epinephelidae according to IUCN Red
List criteria ( www.iucnredlist.org ), data defi cient, least concern, near-threatened and threatened.
For each conservation category the numbers of species known to aggregate ( black bar ) known not
to aggregate ( grey bar ) and of unknown reproductive strategy ( white bar ) are represented as a proportion of the category. The graph suggests that those species known to aggregate are more likely
to be threatened or near-threatened (Craig et al. 2011 ; Sadovy de Mitcheson et al. in press )
0
20
40
60
80
100
Data Deficient
Least Concern Near Threatened
Threatened
Proportion of species in IUCN category
IUCN Conservation category
8 Fishery and Biological Implications of Fishing Spawning Aggregations…
contributed over 50% of landed catch from line-boats out of Durban harbour (Garratt
1996 ; Penney et al. 1999 ) . By the late 1960s, catches in the main fi shing area, KwaZuluNatal (KZN), had collapsed and after several failed management interventions during
the 1980s, a moratorium was placed on the species in 1998 (Mann 2007 ) .
Although large (up to 120 cm TL), the seventy-four is not the largest sea bream in
S. Africa. However, it has one of the shortest and most predictable spawning seasons
of the South African sea bream assemblage, appears to be the most threatened sea
bream and its collapse is one of the best documented examples of severe overfi shing
in S. African waters (reviewed in Mann 2007 ) . Its large spawning aggregations once
lasted from July to November and were heavily fi shed leading to marked declines in
catches and, ultimately, the need for management. However, the species showed little
recovery despite a fi shing moratorium. While there are positive indications of larger
adults in KZN and increased abundance of juveniles in the Eastern Cape, poaching
continues and the high price paid for this desirable, and now rare, fi sh means the
greatest threat to its recovery is the lack of effective enforcement (Mann 2007 ) .
Another sea bream, the red steenbras ( Petrus rupestris ) has suffered a similar fate.
Although its spawning aggregations are less well known; experienced fi shers strongly
indicate that this species aggregates during its spawning periods (August-November)
when the largest catches are made (Bruce Mann personal communication 2009).
The croakers include many highly valued species aggregating to spawn, typically
in coastal or estuarine areas and which are targeted at this time by commercial or
Fig. 8.8 Conservation status of 163 groupers of the family Epinephelidae according to IUCN Red
List criteria ( www.iucnredlist.org ), data defi cient, least concern, near-threatened and threatened.
For each conservation category the numbers of species known to aggregate ( black bar ) known not
to aggregate ( grey bar ) and of unknown reproductive strategy ( white bar ) are represented as a proportion of the category. The graph suggests that those species known to aggregate are more likely
to be threatened or near-threatened (Craig et al. 2011 ; Sadovy de Mitcheson et al. in press )
0
20
40
60
80
100
Data Deficient
Least Concern Near Threatened
Threatened
Proportion of species in IUCN category
IUCN Conservation category