

265
is changed from a water volume oriented to an (bottom) area oriented as 4–5 individuals m
−2
. E� tasmanica juveniles are initially raised in round glass bowls
(approximately 2 L) with sand at the bottom so the juveniles can settle. Unlike
E� hyllebergi juveniles, E� tasmanica immediately settle on the bottom once they
are hatched. Water is changed daily since the volume is small and there is greater
evaporative loss from this volume. At approximately 2–3 weeks, juvenile squids
are transferred to 40-L aquaria with sand on the bottom and raised until sexually
mature (2 months). Generally, 20 squids are kept in an aquarium this size due to
space limitations, but this number does not seem to affect their behaviour with
any visible signs of stress. Since E� tasmanica F1 and F2 generations have higher
growth rates than those caught in the wild, these individuals are moved earlier to
the adult cubicals.
15.6.2 Euprymna hyllebergi Growth
The growth rate from hatching to 100 days of age for E� hyllebergi is approximately
2.4 % in length and 7.5 % in weight. At 60 days after hatching, the squid had grown
to 17-mm length and 2.6-g weight and 22 mm and 6 g at 100 days. Food consumption
of about 0.2 g d
−1
or 37 % body weight d
-1
enables calculation of the food conversion efficiency of about 37 % (range 14–99) from hatching to 100 days. This rate
increases from 30 to 40 % after hatching to 60–70 % during 40–60 days with a peak
of about 64 % between 50 and 60 days (Fig. 15.12). These values potentially relate
to the storage of energy for the consequent reproductive period (Nabhitabhata et al.
2005). At 90 days after hatching, the survival from hatching is approximately 10 %
and from settlement is 70 %.
Transition in growth phases is reflected in the nature of the growth models. The
stage where the models shifted to a higher elevation is at about 30 days after hatching, and this corresponds to the observed settlement stage (Figs. 15.8–15.11). The
second growth phase is from 30 to 122 days. The relationships between ML (mm)
and weight (W, g) can also be expressed as a power regression model (Nabhitabhata
et al. 2005) as happened in the early phase (Fig. 15.9):
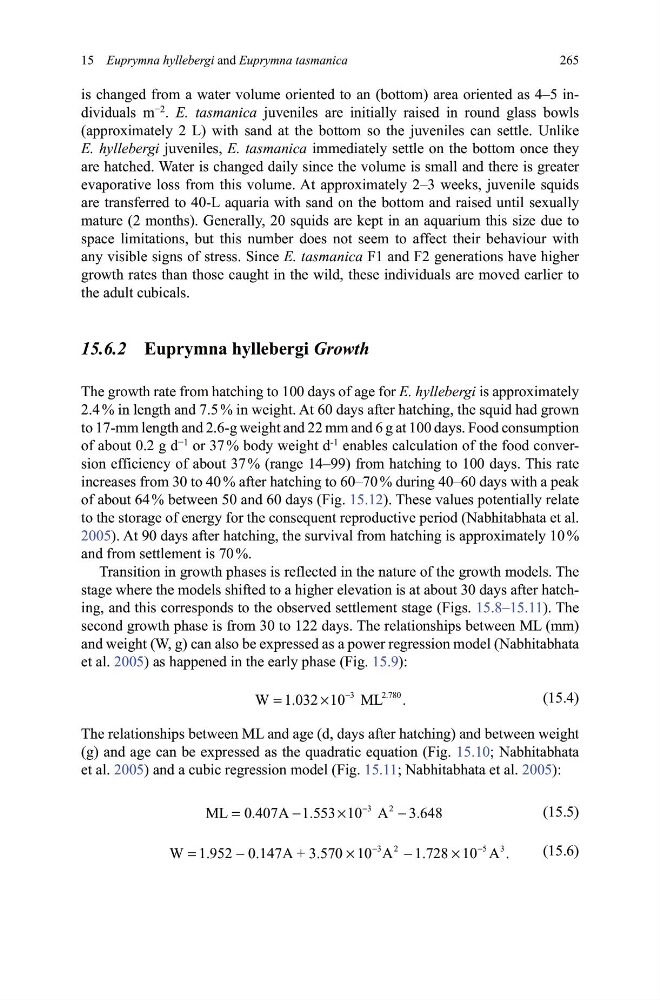
(15.4)
The relationships between ML and age (d, days after hatching) and between weight
(g) and age can be expressed as the quadratic equation (Fig. 15.10; Nabhitabhata
et al. 2005) and a cubic regression model (Fig. 15.11; Nabhitabhata et al. 2005):
(15.5)
(15.6)
3
2.780
W 1.032 10 ML .
−
=
×
3
2
ML 0.407A 1.553 10 A 3.648
−
=
−
×
−
3 2
5
3
W 1.952 0.147A + 3.570 10 A 1.728 10 A .
−
−
=
−
×
−
×
15 Euprymna hyllebergi and Euprymna tasmanica
is changed from a water volume oriented to an (bottom) area oriented as 4–5 individuals m
−2
. E� tasmanica juveniles are initially raised in round glass bowls
(approximately 2 L) with sand at the bottom so the juveniles can settle. Unlike
E� hyllebergi juveniles, E� tasmanica immediately settle on the bottom once they
are hatched. Water is changed daily since the volume is small and there is greater
evaporative loss from this volume. At approximately 2–3 weeks, juvenile squids
are transferred to 40-L aquaria with sand on the bottom and raised until sexually
mature (2 months). Generally, 20 squids are kept in an aquarium this size due to
space limitations, but this number does not seem to affect their behaviour with
any visible signs of stress. Since E� tasmanica F1 and F2 generations have higher
growth rates than those caught in the wild, these individuals are moved earlier to
the adult cubicals.
15.6.2 Euprymna hyllebergi Growth
The growth rate from hatching to 100 days of age for E� hyllebergi is approximately
2.4 % in length and 7.5 % in weight. At 60 days after hatching, the squid had grown
to 17-mm length and 2.6-g weight and 22 mm and 6 g at 100 days. Food consumption
of about 0.2 g d
−1
or 37 % body weight d
-1
enables calculation of the food conversion efficiency of about 37 % (range 14–99) from hatching to 100 days. This rate
increases from 30 to 40 % after hatching to 60–70 % during 40–60 days with a peak
of about 64 % between 50 and 60 days (Fig. 15.12). These values potentially relate
to the storage of energy for the consequent reproductive period (Nabhitabhata et al.
2005). At 90 days after hatching, the survival from hatching is approximately 10 %
and from settlement is 70 %.
Transition in growth phases is reflected in the nature of the growth models. The
stage where the models shifted to a higher elevation is at about 30 days after hatching, and this corresponds to the observed settlement stage (Figs. 15.8–15.11). The
second growth phase is from 30 to 122 days. The relationships between ML (mm)
and weight (W, g) can also be expressed as a power regression model (Nabhitabhata
et al. 2005) as happened in the early phase (Fig. 15.9):
(15.4)
The relationships between ML and age (d, days after hatching) and between weight
(g) and age can be expressed as the quadratic equation (Fig. 15.10; Nabhitabhata
et al. 2005) and a cubic regression model (Fig. 15.11; Nabhitabhata et al. 2005):
(15.5)
(15.6)
3
2.780
W 1.032 10 ML .
−
=
×
3
2
ML 0.407A 1.553 10 A 3.648
−
=
−
×
−
3 2
5
3
W 1.952 0.147A + 3.570 10 A 1.728 10 A .
−
−
=
−
×
−
×
15 Euprymna hyllebergi and Euprymna tasmanica