

Mass balances, nitrifying plants
Reactor
no. Biomass
density
-3mm
100 .---------------------------------~
%
Heterotrophic
bacteria
0
3 100
%
0
4
100
%
0
0
2
3
Reaction
rate
-2 -1
gm d
rA.02
rA.COD
rA.NH4
rA.02
rA,COD
rA,NH4
rA.02
rA,COD
rA,NH4
mm
=
=
=
=
=
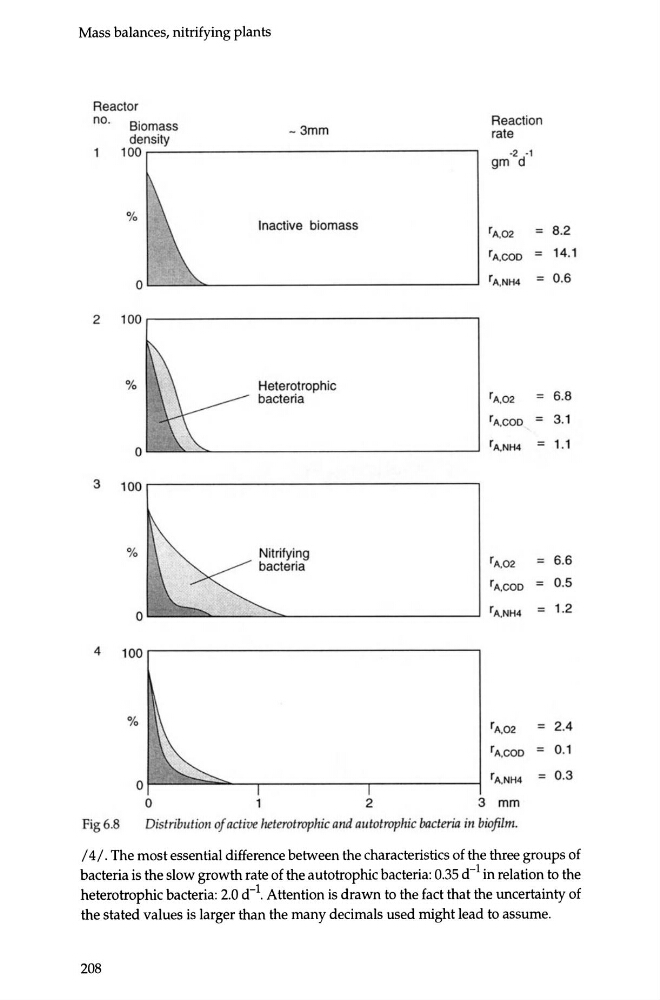
Fig6.8
Distribution of active heterotraphic and autotraphic bacterin in bioftlm.
6.8
3.1
1.1
6.6
0.5
1.2
2.4
0.1
0.3
I 4/ . The most essential difference between the characteristics of the three groups of
bacteria is the slow growth rate of the autotrophic bacteria: 0.35 d- 1 in relation to the
heterotrophic bacteria: 2.0 d- 1 . Attention is drawn to the fact that the uncertainty of
the stated values is larger than the many decimals used might lead to assume.
208
Reactor
no. Biomass
density
-3mm
100 .---------------------------------~
%
Heterotrophic
bacteria
0
3 100
%
0
4
100
%
0
0
2
3
Reaction
rate
-2 -1
gm d
rA.02
rA.COD
rA.NH4
rA.02
rA,COD
rA,NH4
rA.02
rA,COD
rA,NH4
mm
=
=
=
=
=
Fig6.8
Distribution of active heterotraphic and autotraphic bacterin in bioftlm.
6.8
3.1
1.1
6.6
0.5
1.2
2.4
0.1
0.3
I 4/ . The most essential difference between the characteristics of the three groups of
bacteria is the slow growth rate of the autotrophic bacteria: 0.35 d- 1 in relation to the
heterotrophic bacteria: 2.0 d- 1 . Attention is drawn to the fact that the uncertainty of
the stated values is larger than the many decimals used might lead to assume.
208