

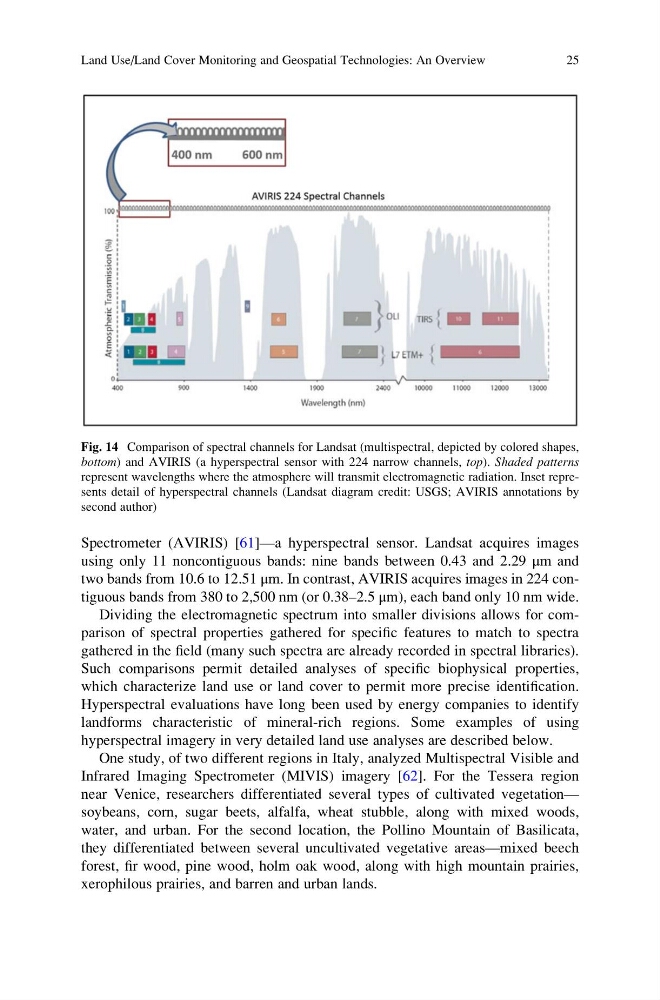
Spectrometer (AVIRIS) [61]—a hyperspectral sensor. Landsat acquires images
using only 11 noncontiguous bands: nine bands between 0.43 and 2.29 μm and
two bands from 10.6 to 12.51 μm. In contrast, AVIRIS acquires images in 224 contiguous bands from 380 to 2,500 nm (or 0.38–2.5 μm), each band only 10 nm wide.
Dividing the electromagnetic spectrum into smaller divisions allows for comparison of spectral properties gathered for specific features to match to spectra
gathered in the field (many such spectra are already recorded in spectral libraries).
Such comparisons permit detailed analyses of specific biophysical properties,
which characterize land use or land cover to permit more precise identification.
Hyperspectral evaluations have long been used by energy companies to identify
landforms characteristic of mineral-rich regions. Some examples of using
hyperspectral imagery in very detailed land use analyses are described below.
One study, of two different regions in Italy, analyzed Multispectral Visible and
Infrared Imaging Spectrometer (MIVIS) imagery [62]. For the Tessera region
near Venice, researchers differentiated several types of cultivated vegetation—
soybeans, corn, sugar beets, alfalfa, wheat stubble, along with mixed woods,
water, and urban. For the second location, the Pollino Mountain of Basilicata,
they differentiated between several uncultivated vegetative areas—mixed beech
forest, fir wood, pine wood, holm oak wood, along with high mountain prairies,
xerophilous prairies, and barren and urban lands.
Fig. 14 Comparison of spectral channels for Landsat (multispectral, depicted by colored shapes,
bottom) and AVIRIS (a hyperspectral sensor with 224 narrow channels, top). Shaded patterns
represent wavelengths where the atmosphere will transmit electromagnetic radiation. Inset represents detail of hyperspectral channels (Landsat diagram credit: USGS; AVIRIS annotations by
second author)
Land Use/Land Cover Monitoring and Geospatial Technologies: An Overview
25
using only 11 noncontiguous bands: nine bands between 0.43 and 2.29 μm and
two bands from 10.6 to 12.51 μm. In contrast, AVIRIS acquires images in 224 contiguous bands from 380 to 2,500 nm (or 0.38–2.5 μm), each band only 10 nm wide.
Dividing the electromagnetic spectrum into smaller divisions allows for comparison of spectral properties gathered for specific features to match to spectra
gathered in the field (many such spectra are already recorded in spectral libraries).
Such comparisons permit detailed analyses of specific biophysical properties,
which characterize land use or land cover to permit more precise identification.
Hyperspectral evaluations have long been used by energy companies to identify
landforms characteristic of mineral-rich regions. Some examples of using
hyperspectral imagery in very detailed land use analyses are described below.
One study, of two different regions in Italy, analyzed Multispectral Visible and
Infrared Imaging Spectrometer (MIVIS) imagery [62]. For the Tessera region
near Venice, researchers differentiated several types of cultivated vegetation—
soybeans, corn, sugar beets, alfalfa, wheat stubble, along with mixed woods,
water, and urban. For the second location, the Pollino Mountain of Basilicata,
they differentiated between several uncultivated vegetative areas—mixed beech
forest, fir wood, pine wood, holm oak wood, along with high mountain prairies,
xerophilous prairies, and barren and urban lands.
Fig. 14 Comparison of spectral channels for Landsat (multispectral, depicted by colored shapes,
bottom) and AVIRIS (a hyperspectral sensor with 224 narrow channels, top). Shaded patterns
represent wavelengths where the atmosphere will transmit electromagnetic radiation. Inset represents detail of hyperspectral channels (Landsat diagram credit: USGS; AVIRIS annotations by
second author)
Land Use/Land Cover Monitoring and Geospatial Technologies: An Overview
25