

• Additional specifics of each site (such as soil parcel size, characteristics of
impervious surfaces, climate, local condition of the surface, or hydrologic
condition)
From such analyses, hydrologists can model the hydrologic behavior of landscapes to form the basis for maintaining water quality and management of runoff.
Two examples of using remotely sensed imagery to identify land use in hydrologic analyses are provided below.
Carlson [45] used Landsat 5 TM images to extract land use for the Spring Creek
Watershed in central Pennsylvania (USA) for two separate years—1986 and 1996.
He used these classified images in an urban growth model to project land use for
2025. Then, using CNs for each land use classification, he calculated actual runoff
coefficients, urban flood ratios, and peak flow rates (using a 25-year storm) for each
year—1986, 1996, and 2025.
In a second example, Melesse and Wang [46] used Landsat imagery to extract
land use to document changes over time in comparing two different hydrologic
models. For one study site—the Red River, North Dakota (USA)—Landsat images
(1974–2001) were used to classify land cover to determine that urban extent had
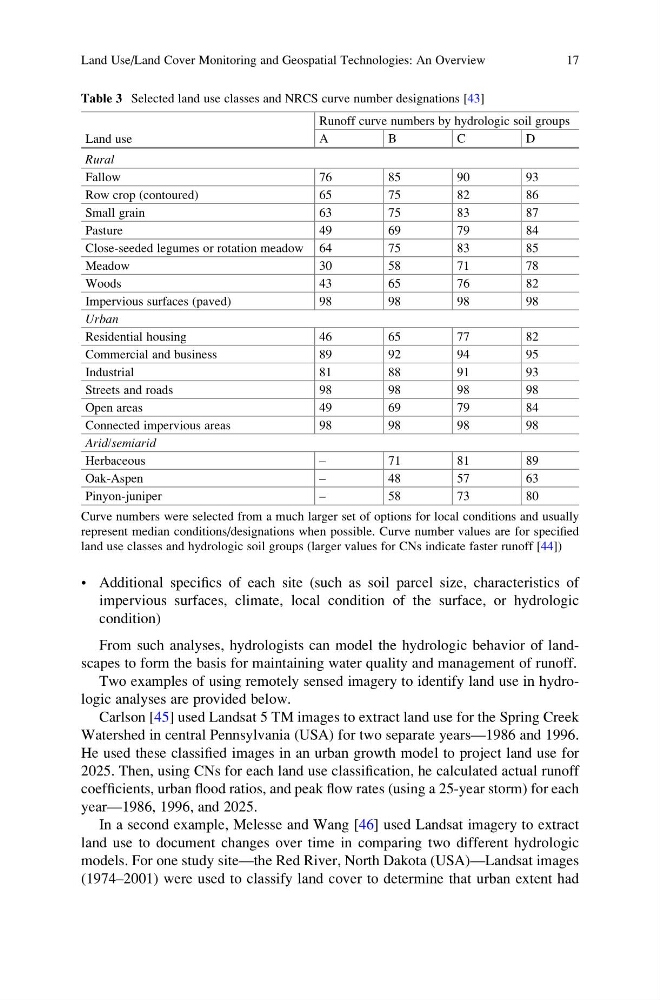
Table 3 Selected land use classes and NRCS curve number designations [43]
Land use
Runoff curve numbers by hydrologic soil groups
A
B
C
D
Rural
Fallow
76
85
90
93
Row crop (contoured)
65
75
82
86
Small grain
63
75
83
87
Pasture
49
69
79
84
Close-seeded legumes or rotation meadow 64
75
83
85
Meadow
30
58
71
78
Woods
43
65
76
82
Impervious surfaces (paved)
98
98
98
98
Urban
Residential housing
46
65
77
82
Commercial and business
89
92
94
95
Industrial
81
88
91
93
Streets and roads
98
98
98
98
Open areas
49
69
79
84
Connected impervious areas
98
98
98
98
Arid/semiarid
Herbaceous
–
71
81
89
Oak-Aspen
–
48
57
63
Pinyon-juniper
–
58
73
80
Curve numbers were selected from a much larger set of options for local conditions and usually
represent median conditions/designations when possible. Curve number values are for specified
land use classes and hydrologic soil groups (larger values for CNs indicate faster runoff [44])
Land Use/Land Cover Monitoring and Geospatial Technologies: An Overview
17
impervious surfaces, climate, local condition of the surface, or hydrologic
condition)
From such analyses, hydrologists can model the hydrologic behavior of landscapes to form the basis for maintaining water quality and management of runoff.
Two examples of using remotely sensed imagery to identify land use in hydrologic analyses are provided below.
Carlson [45] used Landsat 5 TM images to extract land use for the Spring Creek
Watershed in central Pennsylvania (USA) for two separate years—1986 and 1996.
He used these classified images in an urban growth model to project land use for
2025. Then, using CNs for each land use classification, he calculated actual runoff
coefficients, urban flood ratios, and peak flow rates (using a 25-year storm) for each
year—1986, 1996, and 2025.
In a second example, Melesse and Wang [46] used Landsat imagery to extract
land use to document changes over time in comparing two different hydrologic
models. For one study site—the Red River, North Dakota (USA)—Landsat images
(1974–2001) were used to classify land cover to determine that urban extent had
Table 3 Selected land use classes and NRCS curve number designations [43]
Land use
Runoff curve numbers by hydrologic soil groups
A
B
C
D
Rural
Fallow
76
85
90
93
Row crop (contoured)
65
75
82
86
Small grain
63
75
83
87
Pasture
49
69
79
84
Close-seeded legumes or rotation meadow 64
75
83
85
Meadow
30
58
71
78
Woods
43
65
76
82
Impervious surfaces (paved)
98
98
98
98
Urban
Residential housing
46
65
77
82
Commercial and business
89
92
94
95
Industrial
81
88
91
93
Streets and roads
98
98
98
98
Open areas
49
69
79
84
Connected impervious areas
98
98
98
98
Arid/semiarid
Herbaceous
–
71
81
89
Oak-Aspen
–
48
57
63
Pinyon-juniper
–
58
73
80
Curve numbers were selected from a much larger set of options for local conditions and usually
represent median conditions/designations when possible. Curve number values are for specified
land use classes and hydrologic soil groups (larger values for CNs indicate faster runoff [44])
Land Use/Land Cover Monitoring and Geospatial Technologies: An Overview
17