

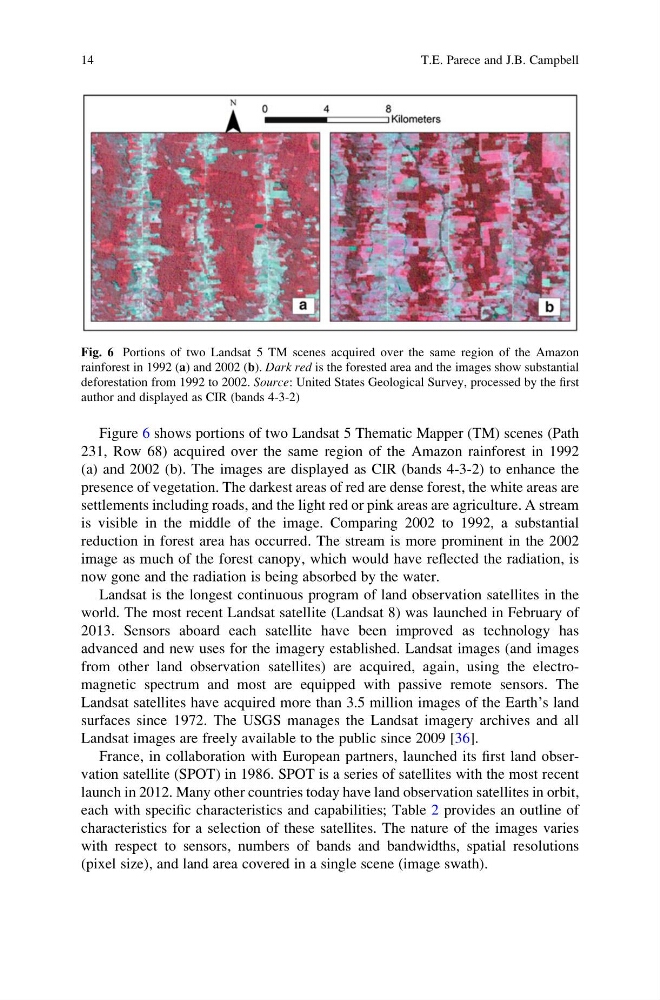
Figure 6 shows portions of two Landsat 5 Thematic Mapper (TM) scenes (Path
231, Row 68) acquired over the same region of the Amazon rainforest in 1992
(a) and 2002 (b). The images are displayed as CIR (bands 4-3-2) to enhance the
presence of vegetation. The darkest areas of red are dense forest, the white areas are
settlements including roads, and the light red or pink areas are agriculture. A stream
is visible in the middle of the image. Comparing 2002 to 1992, a substantial
reduction in forest area has occurred. The stream is more prominent in the 2002
image as much of the forest canopy, which would have reflected the radiation, is
now gone and the radiation is being absorbed by the water.
Landsat is the longest continuous program of land observation satellites in the
world. The most recent Landsat satellite (Landsat 8) was launched in February of
2013. Sensors aboard each satellite have been improved as technology has
advanced and new uses for the imagery established. Landsat images (and images
from other land observation satellites) are acquired, again, using the electromagnetic spectrum and most are equipped with passive remote sensors. The
Landsat satellites have acquired more than 3.5 million images of the Earth’s land
surfaces since 1972. The USGS manages the Landsat imagery archives and all
Landsat images are freely available to the public since 2009 [36].
France, in collaboration with European partners, launched its first land observation satellite (SPOT) in 1986. SPOT is a series of satellites with the most recent
launch in 2012. Many other countries today have land observation satellites in orbit,
each with specific characteristics and capabilities; Table 2 provides an outline of
characteristics for a selection of these satellites. The nature of the images varies
with respect to sensors, numbers of bands and bandwidths, spatial resolutions
(pixel size), and land area covered in a single scene (image swath).
Fig. 6 Portions of two Landsat 5 TM scenes acquired over the same region of the Amazon
rainforest in 1992 (a) and 2002 (b). Dark red is the forested area and the images show substantial
deforestation from 1992 to 2002. Source: United States Geological Survey, processed by the first
author and displayed as CIR (bands 4-3-2)
14
T.E. Parece and J.B. Campbell
231, Row 68) acquired over the same region of the Amazon rainforest in 1992
(a) and 2002 (b). The images are displayed as CIR (bands 4-3-2) to enhance the
presence of vegetation. The darkest areas of red are dense forest, the white areas are
settlements including roads, and the light red or pink areas are agriculture. A stream
is visible in the middle of the image. Comparing 2002 to 1992, a substantial
reduction in forest area has occurred. The stream is more prominent in the 2002
image as much of the forest canopy, which would have reflected the radiation, is
now gone and the radiation is being absorbed by the water.
Landsat is the longest continuous program of land observation satellites in the
world. The most recent Landsat satellite (Landsat 8) was launched in February of
2013. Sensors aboard each satellite have been improved as technology has
advanced and new uses for the imagery established. Landsat images (and images
from other land observation satellites) are acquired, again, using the electromagnetic spectrum and most are equipped with passive remote sensors. The
Landsat satellites have acquired more than 3.5 million images of the Earth’s land
surfaces since 1972. The USGS manages the Landsat imagery archives and all
Landsat images are freely available to the public since 2009 [36].
France, in collaboration with European partners, launched its first land observation satellite (SPOT) in 1986. SPOT is a series of satellites with the most recent
launch in 2012. Many other countries today have land observation satellites in orbit,
each with specific characteristics and capabilities; Table 2 provides an outline of
characteristics for a selection of these satellites. The nature of the images varies
with respect to sensors, numbers of bands and bandwidths, spatial resolutions
(pixel size), and land area covered in a single scene (image swath).
Fig. 6 Portions of two Landsat 5 TM scenes acquired over the same region of the Amazon
rainforest in 1992 (a) and 2002 (b). Dark red is the forested area and the images show substantial
deforestation from 1992 to 2002. Source: United States Geological Survey, processed by the first
author and displayed as CIR (bands 4-3-2)
14
T.E. Parece and J.B. Campbell