

During the 1930s, scientists at the Tennessee Valley Authority (TVA) in the United
States developed methods for systematic interpretation of aerial photography to
extract land use and agricultural information, as well as rural settlement patterns
[31, 32]. Those methods are no longer used but form the foundation for extracting
land use information from aerial photographs.
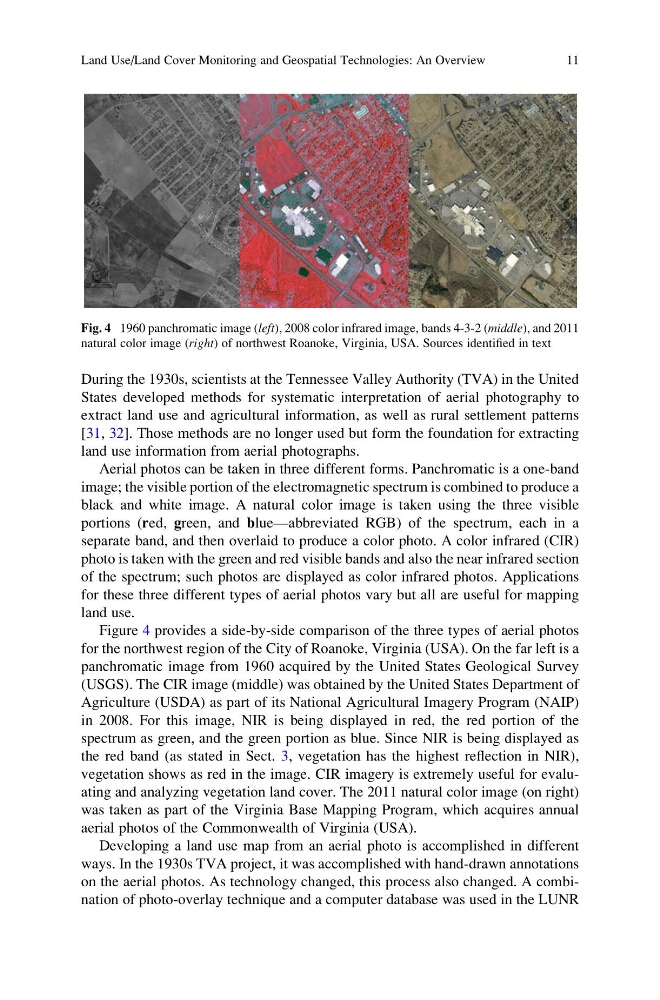
Aerial photos can be taken in three different forms. Panchromatic is a one-band
image; the visible portion of the electromagnetic spectrum is combined to produce a
black and white image. A natural color image is taken using the three visible
portions (red, green, and blue—abbreviated RGB) of the spectrum, each in a
separate band, and then overlaid to produce a color photo. A color infrared (CIR)
photo is taken with the green and red visible bands and also the near infrared section
of the spectrum; such photos are displayed as color infrared photos. Applications
for these three different types of aerial photos vary but all are useful for mapping
land use.
Figure 4 provides a side-by-side comparison of the three types of aerial photos
for the northwest region of the City of Roanoke, Virginia (USA). On the far left is a
panchromatic image from 1960 acquired by the United States Geological Survey
(USGS). The CIR image (middle) was obtained by the United States Department of
Agriculture (USDA) as part of its National Agricultural Imagery Program (NAIP)
in 2008. For this image, NIR is being displayed in red, the red portion of the
spectrum as green, and the green portion as blue. Since NIR is being displayed as
the red band (as stated in Sect. 3, vegetation has the highest reflection in NIR),
vegetation shows as red in the image. CIR imagery is extremely useful for evaluating and analyzing vegetation land cover. The 2011 natural color image (on right)
was taken as part of the Virginia Base Mapping Program, which acquires annual
aerial photos of the Commonwealth of Virginia (USA).
Developing a land use map from an aerial photo is accomplished in different
ways. In the 1930s TVA project, it was accomplished with hand-drawn annotations
on the aerial photos. As technology changed, this process also changed. A combination of photo-overlay technique and a computer database was used in the LUNR
Fig. 4 1960 panchromatic image (left), 2008 color infrared image, bands 4-3-2 (middle), and 2011
natural color image (right) of northwest Roanoke, Virginia, USA. Sources identified in text
Land Use/Land Cover Monitoring and Geospatial Technologies: An Overview
11
States developed methods for systematic interpretation of aerial photography to
extract land use and agricultural information, as well as rural settlement patterns
[31, 32]. Those methods are no longer used but form the foundation for extracting
land use information from aerial photographs.
Aerial photos can be taken in three different forms. Panchromatic is a one-band
image; the visible portion of the electromagnetic spectrum is combined to produce a
black and white image. A natural color image is taken using the three visible
portions (red, green, and blue—abbreviated RGB) of the spectrum, each in a
separate band, and then overlaid to produce a color photo. A color infrared (CIR)
photo is taken with the green and red visible bands and also the near infrared section
of the spectrum; such photos are displayed as color infrared photos. Applications
for these three different types of aerial photos vary but all are useful for mapping
land use.
Figure 4 provides a side-by-side comparison of the three types of aerial photos
for the northwest region of the City of Roanoke, Virginia (USA). On the far left is a
panchromatic image from 1960 acquired by the United States Geological Survey
(USGS). The CIR image (middle) was obtained by the United States Department of
Agriculture (USDA) as part of its National Agricultural Imagery Program (NAIP)
in 2008. For this image, NIR is being displayed in red, the red portion of the
spectrum as green, and the green portion as blue. Since NIR is being displayed as
the red band (as stated in Sect. 3, vegetation has the highest reflection in NIR),
vegetation shows as red in the image. CIR imagery is extremely useful for evaluating and analyzing vegetation land cover. The 2011 natural color image (on right)
was taken as part of the Virginia Base Mapping Program, which acquires annual
aerial photos of the Commonwealth of Virginia (USA).
Developing a land use map from an aerial photo is accomplished in different
ways. In the 1930s TVA project, it was accomplished with hand-drawn annotations
on the aerial photos. As technology changed, this process also changed. A combination of photo-overlay technique and a computer database was used in the LUNR
Fig. 4 1960 panchromatic image (left), 2008 color infrared image, bands 4-3-2 (middle), and 2011
natural color image (right) of northwest Roanoke, Virginia, USA. Sources identified in text
Land Use/Land Cover Monitoring and Geospatial Technologies: An Overview
11