

As technology improved, sensors were not only able to collect the data in multiple
bands
2 (initially just across the visible spectrum—blue, green, and red) but also able
to display images as natural color. These multispectral images advanced remote
sensing analyses by using spectral signatures of different features, as defined by
individual spectral bands.
Additional advances in technology permitted sensors to collect radiation outside
the visible spectrum, first in the near infrared (NIR) and later the longer wavelengths, mid (MIR) and far infrared (FIR). Human eyes cannot see these portions of
the spectrum, but cameras and other image sensors can measure this radiation and
record it as brightness values. These brightness values can then be represented using
the colors of the visible spectrum. Thus, we can use visible radiation to display the
nonvisible. Specialized software is used for this display and the user chooses which
bands are displayed in the software’s view screen. Specific images will be discussed
in later sections of this chapter.
Software used to display remotely sensed images is also used for analyzing the
images for specific applications. Each pixel of an individual band of an image has a
set of brightness values, representing a feature’s spectral signature within that pixel.
These values can be enhanced in various ways, which forms the basis of remote
sensing analyses. The features can be analyzed within an individual band but
multiband analyses are more robust. Some of the most frequently used techniques
in spectral enhancement are spectral ratios and indices. For example, when using
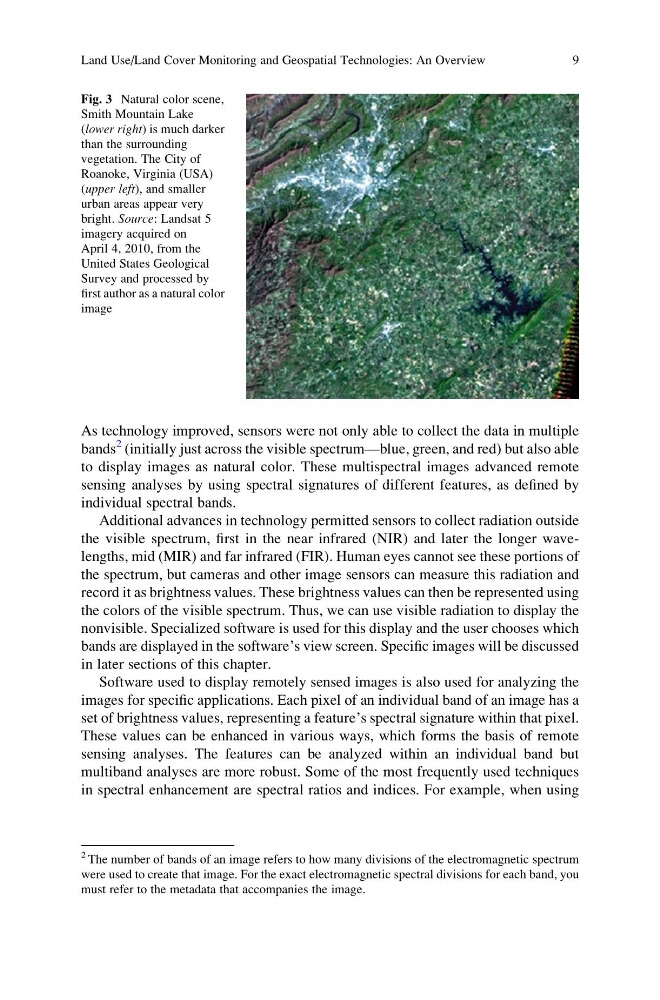
Fig. 3 Natural color scene,
Smith Mountain Lake
(lower right) is much darker
than the surrounding
vegetation. The City of
Roanoke, Virginia (USA)
(upper left), and smaller
urban areas appear very
bright. Source: Landsat 5
imagery acquired on
April 4, 2010, from the
United States Geological
Survey and processed by
first author as a natural color
image
2 The number of bands of an image refers to how many divisions of the electromagnetic spectrum
were used to create that image. For the exact electromagnetic spectral divisions for each band, you
must refer to the metadata that accompanies the image.
Land Use/Land Cover Monitoring and Geospatial Technologies: An Overview
9
bands
2 (initially just across the visible spectrum—blue, green, and red) but also able
to display images as natural color. These multispectral images advanced remote
sensing analyses by using spectral signatures of different features, as defined by
individual spectral bands.
Additional advances in technology permitted sensors to collect radiation outside
the visible spectrum, first in the near infrared (NIR) and later the longer wavelengths, mid (MIR) and far infrared (FIR). Human eyes cannot see these portions of
the spectrum, but cameras and other image sensors can measure this radiation and
record it as brightness values. These brightness values can then be represented using
the colors of the visible spectrum. Thus, we can use visible radiation to display the
nonvisible. Specialized software is used for this display and the user chooses which
bands are displayed in the software’s view screen. Specific images will be discussed
in later sections of this chapter.
Software used to display remotely sensed images is also used for analyzing the
images for specific applications. Each pixel of an individual band of an image has a
set of brightness values, representing a feature’s spectral signature within that pixel.
These values can be enhanced in various ways, which forms the basis of remote
sensing analyses. The features can be analyzed within an individual band but
multiband analyses are more robust. Some of the most frequently used techniques
in spectral enhancement are spectral ratios and indices. For example, when using
Fig. 3 Natural color scene,
Smith Mountain Lake
(lower right) is much darker
than the surrounding
vegetation. The City of
Roanoke, Virginia (USA)
(upper left), and smaller
urban areas appear very
bright. Source: Landsat 5
imagery acquired on
April 4, 2010, from the
United States Geological
Survey and processed by
first author as a natural color
image
2 The number of bands of an image refers to how many divisions of the electromagnetic spectrum
were used to create that image. For the exact electromagnetic spectral divisions for each band, you
must refer to the metadata that accompanies the image.
Land Use/Land Cover Monitoring and Geospatial Technologies: An Overview
9