

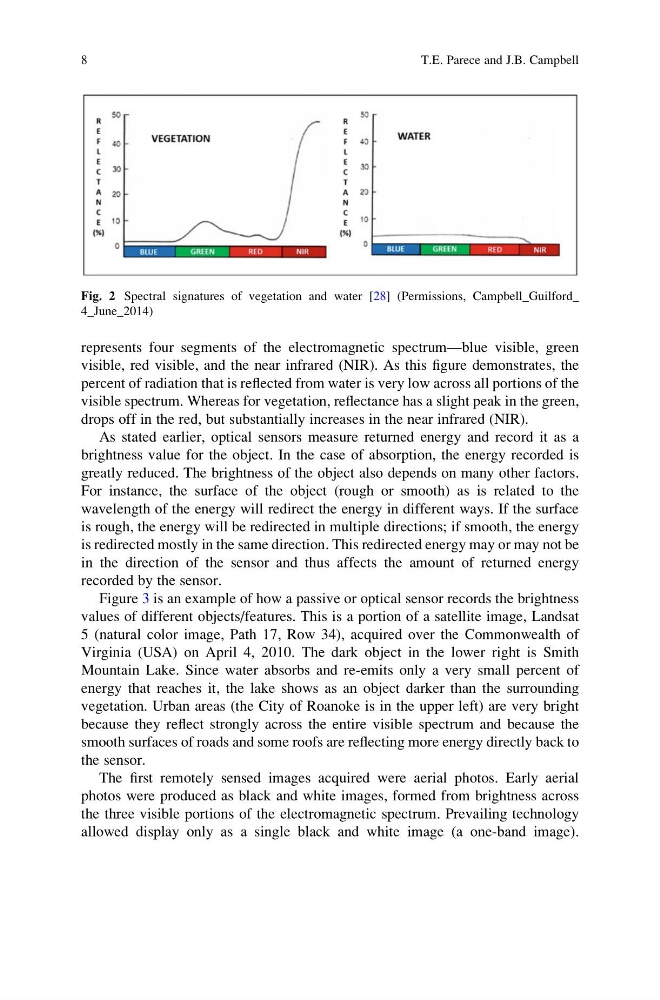
represents four segments of the electromagnetic spectrum—blue visible, green
visible, red visible, and the near infrared (NIR). As this figure demonstrates, the
percent of radiation that is reflected from water is very low across all portions of the
visible spectrum. Whereas for vegetation, reflectance has a slight peak in the green,
drops off in the red, but substantially increases in the near infrared (NIR).
As stated earlier, optical sensors measure returned energy and record it as a
brightness value for the object. In the case of absorption, the energy recorded is
greatly reduced. The brightness of the object also depends on many other factors.
For instance, the surface of the object (rough or smooth) as is related to the
wavelength of the energy will redirect the energy in different ways. If the surface
is rough, the energy will be redirected in multiple directions; if smooth, the energy
is redirected mostly in the same direction. This redirected energy may or may not be
in the direction of the sensor and thus affects the amount of returned energy
recorded by the sensor.
Figure 3 is an example of how a passive or optical sensor records the brightness
values of different objects/features. This is a portion of a satellite image, Landsat
5 (natural color image, Path 17, Row 34), acquired over the Commonwealth of
Virginia (USA) on April 4, 2010. The dark object in the lower right is Smith
Mountain Lake. Since water absorbs and re-emits only a very small percent of
energy that reaches it, the lake shows as an object darker than the surrounding
vegetation. Urban areas (the City of Roanoke is in the upper left) are very bright
because they reflect strongly across the entire visible spectrum and because the
smooth surfaces of roads and some roofs are reflecting more energy directly back to
the sensor.
The first remotely sensed images acquired were aerial photos. Early aerial
photos were produced as black and white images, formed from brightness across
the three visible portions of the electromagnetic spectrum. Prevailing technology
allowed display only as a single black and white image (a one-band image).
Fig. 2 Spectral signatures of vegetation and water [28] (Permissions, Campbell_Guilford_
4_June_2014)
8
T.E. Parece and J.B. Campbell
visible, red visible, and the near infrared (NIR). As this figure demonstrates, the
percent of radiation that is reflected from water is very low across all portions of the
visible spectrum. Whereas for vegetation, reflectance has a slight peak in the green,
drops off in the red, but substantially increases in the near infrared (NIR).
As stated earlier, optical sensors measure returned energy and record it as a
brightness value for the object. In the case of absorption, the energy recorded is
greatly reduced. The brightness of the object also depends on many other factors.
For instance, the surface of the object (rough or smooth) as is related to the
wavelength of the energy will redirect the energy in different ways. If the surface
is rough, the energy will be redirected in multiple directions; if smooth, the energy
is redirected mostly in the same direction. This redirected energy may or may not be
in the direction of the sensor and thus affects the amount of returned energy
recorded by the sensor.
Figure 3 is an example of how a passive or optical sensor records the brightness
values of different objects/features. This is a portion of a satellite image, Landsat
5 (natural color image, Path 17, Row 34), acquired over the Commonwealth of
Virginia (USA) on April 4, 2010. The dark object in the lower right is Smith
Mountain Lake. Since water absorbs and re-emits only a very small percent of
energy that reaches it, the lake shows as an object darker than the surrounding
vegetation. Urban areas (the City of Roanoke is in the upper left) are very bright
because they reflect strongly across the entire visible spectrum and because the
smooth surfaces of roads and some roofs are reflecting more energy directly back to
the sensor.
The first remotely sensed images acquired were aerial photos. Early aerial
photos were produced as black and white images, formed from brightness across
the three visible portions of the electromagnetic spectrum. Prevailing technology
allowed display only as a single black and white image (a one-band image).
Fig. 2 Spectral signatures of vegetation and water [28] (Permissions, Campbell_Guilford_
4_June_2014)
8
T.E. Parece and J.B. Campbell